


The Client: Risk Management Journey
Introduction
A few years after developing and implementing a robust internal audit function, Capital Guidance (the Company) was keen to put in place an equally effective risk management function. Yet there were several questions to be answered first - How does one move from internal audit to risk management? What is the organization’s current risk management maturity level? What are the different phases and stages involved in taking risk management from start to finish? How does one deploy the concepts of a risk appetite, risk tolerance, risk maturity, and risk assessments? Should one use a top-down or bottom-up approach? How are risks, controls, processes, and KRIs linked? Is risk management software required, and if so, which one?
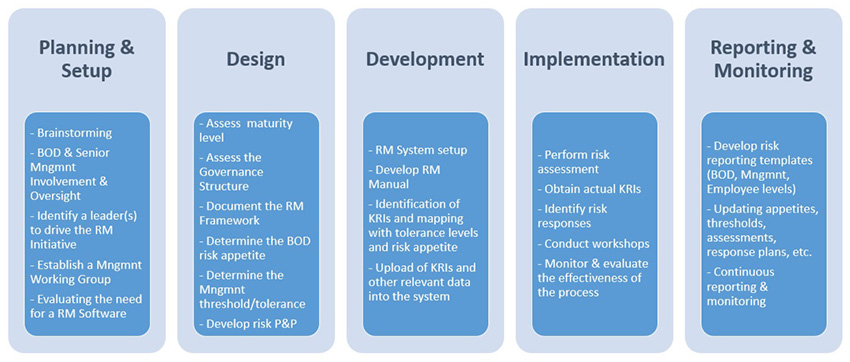
Given the expertise and knowledge of the internal audit (IA) team, the board put them in charge of addressing these questions, and help management establish the new risk management function before turning the project completely to the management with oversight by the IA team. The Risk Management Function - Phases table illustrates the different phases and stages developed by the team to establish a risk management function.

Design
The RM team was keen to strengthen the company’s risk maturity, minimize ad hoc risk management processes, and develop more consistent, integrated, and optimized processes. They began by assessing Company 5’s risk maturity against a scale of 1 -6 with 6 being the highest:
- Level 1 – Ad hoc, inconsistent risk management processes, lack of linkage
- Level 2 – Consistent risk management, better communication and coordination
- Level 3 – Integration between risk management and product development and other execution processes
- Level 4 – Advanced risk management with scenario analyses and top-down and bottom-up approaches
- Level 5 – Optimized risk management, linked to portfolio and risk analysis with formalized inputs from suppliers and customers
- Level 6 – Cross-organizational scenario analysis, distributed risk management input used to support forecasting and lifecycle planning, risk management framework used to facilitate situational awareness across supply network
Risk Management Functions
Using different questionaries’ and interviews, when Company 5 was assessed against this scale, they were found to be at Level 1 – the ad hoc level. That was because the company operated in different countries as separate siloes. There was no connection between departments when it came to managing risk. The plan was to take them to a more optimized level of risk maturity with better integration, communication, synergy, and collaboration between departments.
The next step was to visualize the risk management framework. The RM team decided that the best approach would be to link KRIs to risks, risks to processes, processes to department/functions, departments to countries, countries to core businesses, and eventually core businesses to the larger group.
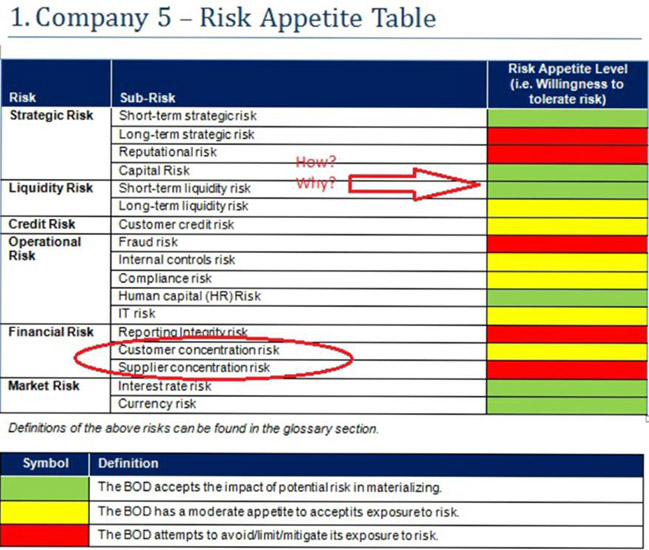
The RM team then met with the respective Board to determine Company 5’s appetite for various risks, including strategic risks, liquidity risks, credit risks, operational risks, financial risks, and market risks. A color coded table was developed to represent the company’s risk appetite level or willingness to tolerate a particular risk. For instance, in the Risk Appetite Table below, short-term strategic risk is color-coded green which indicates that the company is willing to accept this risk. However, long-term strategic risk is colored red, which means that company will want to avoid or mitigate this risk.
Capital risk and short-term liquidity risk are both green. At first glance, that might not make sense – why would the Board be willing to risk their capital? But the fact is that the Board did not invest significant amount of money in Company 5. They used their reputation to establish the company. That is why capital risk is green, but reputation risk is red.
Going further down the table, the company has a moderate appetite for customer concentration risk (yellow). Yet they are inclined to avoid exposure to supplier concentration risk (red) i.e. they don’t want to depend only on one or two suppliers.
Risk Appetite Table
The group structure diagram below demonstrates how the Company designed their risk management initial project. Out of their six businesses, Company 5 with a branch located in China was chosen for the initial project. This company has several processes, including payables, receivables, cash management, and fixed asset management. Each process has several risks, and each risk has several KRIs. For instance, the receivables process has 5 risks. Risk 2, specifically, has three KRIs defined.
Risk Management Framework
So, at the board level of the core business (Company 5), the risk appetite was defined, and then had to permeate down to the bottom. At the same time, risk information – all the way down from the KRI level of a particular risk and process – had to be rolled up from the bottom to the top. This way, the company’s vision of a top-down and bottom-up approach could be realized.
Company 5 then designed risk management policies and procedures, an example of which can be seen in the following diagram.
Liquidity Risk Policies & Procedures
Development
At this stage, Company 5 in China implemented a risk management system/ software to manage and monitor all the processes that were discussed in phase 1 and 2. They also uploaded their KRIs into the system for reporting, along with expected, critical, and non-critical KRI values.
The receivables process, for instance has three KRIs – percentage of deviation from the sales target (percent value), value of cash in the bank (dollar value), and receivables turnover (ratio). With respect to the first KRI in the KRI thresholds chart, a 10% deviation from the sales target would be expected. But a 20% deviation would be critical and reportable (rising monitoring trend).
Similarly, the value of cash in the bank was expected to be $250,000. If it rose to $500,000, it would become critical because the surfeit of cash would need to be utilized. If it dropped to $150,000, it again would become critical because then the company would not have enough money to run their operations (both monitoring trend).
KRI Thresholds
Implementation
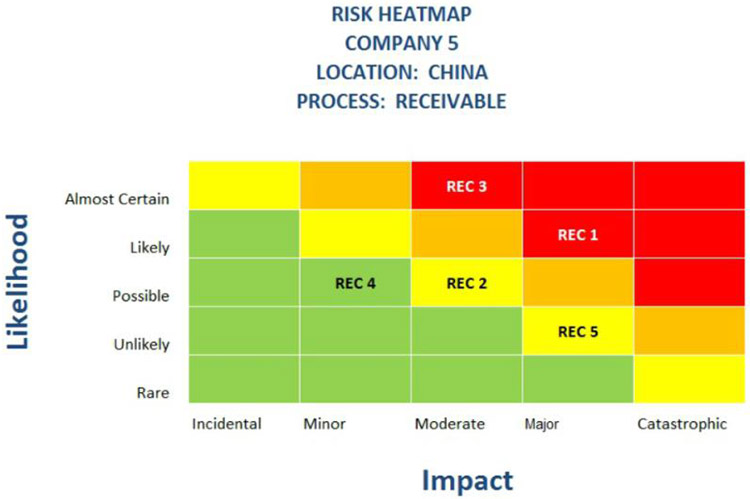
Risk assessments were the key focus of the implementation phase. The 5 risks in the receivables process were assessed, rated, and plotted on a risk heat map, as seen below. Therefore, at one glance stakeholders could study each risk in terms of its impact (incidental, minor, moderate, major, and catastrophic) and likelihood (rare, unlikely, possible, likely, almost certain to occur).
Risk Ranking
Based on the risk score, the management team could decide how they wanted to respond. Take, for example, the risk of lack of segregation of duties in the receivables function, as mentioned in the Risk Ranking table above. After being assessed, the risk is ranked 8 (Impact + Likelihood). Based on the risk heat map, this risk seems to be major in terms of impact, and likely to occur. Therefore, the management would choose to avoid the risk. Similarly, the risk of “inefficient collectability to the receivables” is ranked 6 i.e. there is a possibility that the risk can occur, and have a moderate impact. So, the management’s response would be to reduce this risk.
After establishing risk assessment and response strategies, the company updated their KRIs with the actual values (vs. expected values) for each quarter (Q4 2012 – Q1 2014). In the table below, for Q4 2012, the actual percentage of deviation from the sales target was 30% vs. the expected deviation of 10%. By Q1 2014, when the expected deviation was 10%, the actual deviation was 25%.
In this way, the company calculates various KRI thresholds, comparing actual against expected values. All this data is uploaded into the risk management system.
KRIs: Actual values vs. expected values
Once the KRIs were defined, the RM team conducted a training workshop to ensure that everyone – right from the board level to the administrative personnel – understood their risk management responsibilities, and would be fully engaged in the process (hence, enhancing the risk culture awareness). They also performed evaluations to determine if the risk management implementation was effective and efficient.
Reporting
The company developed risk reporting templates at various levels of the organization – board level, management level, and employee level (they all received portion of the risk reporting package). They also updated risk appetites, thresholds, assessments, and response plans. Continuous risk reporting and monitoring was facilitated, as were regular evaluations of the risk management processes. Risk reporting package composes of two levels – the risk level and the KRI level.
All relevant KRIs were plotted on risk reports to identify key issues and concerns. For instance, in the graph below, two reportable issues were identified. The first was in Q4 2012 and the second was in Q1 2014 where the percentage of deviation from the expected sales target was 30% and 25% respectively -- both above the critical maximum thresholds.
Reportable issues Risk-Reporting
Implementing a Robust Risk Management Program
The Company’s new risk management program is characterized by a well-defined risk appetite, streamlined risk assessments, links between different risks and processes, and proactive risk-response strategies. Risk thresholds and tolerance levels are closely tracked, with automated alerts indicating when any limits are breached. Comprehensive policies and procedures, supported by training processes help everyone in the company understand the “do’s” and “don’ts” of risk management.
Here are the steps that the Company took to implement its risk management processes:
Planning and Set-up
Since it was important to get the board and senior management involved in risk management implementation and oversight, the risk management (RM) team (including Internal Audit) met with them for initial brainstorming sessions and high level discussions. Instead of rushing ahead and trying to establish risk management processes across all businesses and industries, the RM team felt that a better approach would be to begin with an initial implementation project in one business and one country. This would put them in a better position to experiment, learn, and zero in on the most effective risk management practices which could then be rolled out across the rest of the company.
Out of various businesses and countries the Company is involved in, the RM team chose Company 5 and its operation in China for the initial risk management project. After getting the buy-in and approval of the board and management team, the RM team chose a management working group and leaders to drive the initiative. They did not want to hire any new managers or outsource these leadership roles. After all, the RM team believed that the management in Company 5 was more capable than anyone else of understanding their organization’s risk. So these members were given key risk management responsibilities.
Benefits
- Improved risk management maturity
The Company is steadily strengthening their risk management maturity by implementing integrated, streamlined, and consistent processes for risk assessment, mitigation, and reporting. - Greater visibility into risks
Tools such as color coded risk appetite tables, risk threshold reports (with expected, critical, and non-critical values), KRIs (expressed as ratios, percentages, or dollar values), risk impact and likelihood heat maps, and powerful dashboards provide in-depth visibility into risk data, highlighting high risk areas and issues of concern, so that managers can respond appropriately and in a timely manner. - Simplified risk inventories
All risk data is consolidated and maintained in a centralized database instead of multiple separate systems scattered across the enterprise. This unified approach has helped standardize risk taxonomies, and facilitated consistency in the way risks are managed and reported. - A culture of risk management
Policies and procedures for managing various types of risks, supported by comprehensive training processes, help ensure that everyone across the company understands their roles and responsibilities in helping the company balance its risks and rewards.
Best Practices
Assess and monitor alignment throughout the project – between the board and their risk appetite, the management and their expectations, and the risks and their KRIs. Acknowledge the management’s perspective on risk and team with them. Use practical risk language rather than technical terms. Think out of the box. Choose what’s best for your company. Step back, look, think, and evaluate the big picture. Be creative, proactive, and flexible. Each company or business unit in your organization will have a different perspective on risk management. Be a leader not a manager. Engage people in the risk management process. Communicate the value-add, issues, and challenges as early as possible and to the appropriate people. Demonstrate the result by providing the board and management with deliverable and progress reports at each stage. Be efficient and effective by utilizing in-house resources. Capital Guidance used the internal audit team to spearhead the risk management implementation.
Subscribe for Latest Updates
Subscribe Now