


Introduction
A risk management dashboard is a centralized digital platform that visually displays an organization's critical risk metrics, enabling decision-makers to monitor, assess, and act on risk exposure across all business domains in real time. The dashboard consolidates data from multiple sources, including risk registers, control testing systems, KRI feeds, and incident logs, into charts, heat maps, and tables that provide a continuously updated view of the organization's risk posture.
Today's organizations are inundated with data, from internal operations to external market dynamics. What’s often overlooked, though, is how this data is processed and translated into decision-making power.
According to Forrester's The State of Enterprise Risk Management 2025, firms without board-level ERM visibility were 20% more likely to suffer six or more critical risk events in a year. The pressure isn't confined to managing risks but rather about sifting through noise to identify what matters. With countless variables impacting performance, finance, or compliance, the challenge is understanding which insights require action and which can be set aside. The complexity can overwhelm even the most experienced leadership, leading to decisions based on guesswork instead of grounded insights.
In the chaos of daily operations, leaders need a clear, real-time view of how their decisions impact both short-term objectives and long-term goals. What’s needed is an organized, intuitive approach to visualizing risks and opportunities - something that pulls everything into a single, actionable source of truth, enabling smart decisions that drive both stability and growth.
Key Takeaways
A risk management dashboard is a centralized platform that visually displays critical risk metrics, offering decision-makers a clear view of their risk landscape.
Why Do You Need a Risk Management Dashboard: A dashboard uncovers hidden risks, provides data-driven insights, improves accountability, and enables the effective allocation of resources. It also simplifies compliance and enhances collaboration across teams.
KPIs: KPIs like risk exposure levels, incident response times, and compliance adherence rates help organizations prioritize risks and measure the effectiveness of their mitigation strategies, ensuring that their efforts align with business goals.
How to Design a Risk Management Dashboard: Designing an effective dashboard involves defining its purpose, selecting relevant KPIs, integrating reliable data, and ensuring usability. Security, interactivity, and ongoing evaluation are also essential components to maintain its functionality.
What is a Risk Management Dashboard?
A risk management dashboard is a tool designed to provide an at-a-glance overview of an organization's risk landscape, enabling decision-makers to monitor, assess, and mitigate risks efficiently. It consolidates data from various sources, offering a centralized platform that visually represents critical risk metrics and key performance indicators (KPIs).
By presenting data in an easily digestible format through charts, graphs, and tables, risk management dashboards help enhance transparency and communication across departments, ultimately supporting the organization's strategic goals.
Why Do You Need a Risk Management Dashboard?
As businesses face complex risks, having the right tools to track, assess, and act becomes crucial. The following are the key reasons why a risk management dashboard is the solution that bridges awareness with action.
- Uncover Hidden Risks Before They Escalate A risk management dashboard provides real-time visibility into emerging risks that might otherwise go unnoticed. By aggregating data from various sources, you can quickly detect patterns and trends that may pose future threats to your organization. Early identification enables timely intervention, preventing minor issues from escalating into major crises.
- Act on Data-Driven Insights with Confidence With a comprehensive view of risks and their potential impact, a dashboard empowers decision-makers to act based on solid, data-backed insights. Instead of relying on gut feelings or fragmented reports, leadership teams can assess the probability and consequences of each risk, leading to more informed and strategic choices across departments.
- Improve Accountability A risk management dashboard ensures that responsibilities are clearly defined and assigned. When risks are visible to all relevant stakeholders, there is greater accountability. Teams can track mitigation efforts, follow progress, and ensure that all departments are aligned on risk-related goals. This, in turn, drives collaboration and ensures that everyone knows their role in managing risks.
- Allocate Resources Where They're Needed Most Having a holistic view of risk exposure allows organizations to allocate resources more effectively. A dashboard helps prioritize which areas require the most attention, ensuring that time, budget, and personnel are focused on mitigating the highest risks first. This targeted approach enhances operational efficiency by addressing the most critical vulnerabilities head-on.
- Simplify Compliance and Regulatory Reporting For industries operating within strict regulatory requirements, a risk management dashboard can significantly ease the burden of compliance. By providing detailed, up-to-date reports on how risks are managed, the dashboard can simplify audits and ensure adherence to various standards. This reduces the administrative strain of manual reporting and ensures that the organization stays compliant without any added complexity.
Examples of Risk Management Dashboards
Let's explore examples of how risk management dashboards are implemented across different sectors, illustrating their versatility in mitigating risks:
- In the manufacturing industry, a risk management dashboard might track and analyze risks associated with supply chain disruptions. For example, such a dashboard could display metrics related to supplier performance, delivery timelines, and geopolitical factors that may affect raw material availability. By providing an overview of these variables, the dashboard enables manufacturers to identify potential supply chain bottlenecks and devise contingency plans to ensure uninterrupted production.
- In another scenario, consider a technology firm that is heavily invested in cybersecurity. Its risk management dashboard aggregates data from various security systems, highlighting potential threats and vulnerabilities. The dashboard provides visualizations of ongoing cyber threats, categorizes them based on severity, and tracks the response actions taken. This enables the IT security team to prioritize threats, manage incident responses effectively, and ensure compliance with regulatory standards. Furthermore, the dashboard aids in assessing the effectiveness of the implemented security measures over time, supporting continuous improvement in the company's cybersecurity posture.
- In the energy sector, companies dealing with oil and gas extraction could benefit from a risk management dashboard that monitors environmental risks and compliance with safety regulations. This dashboard might track data related to weather patterns, equipment maintenance schedules, and safety incidents to predict and mitigate potential hazards. By providing an integrated view of these risks, the dashboard helps the company adhere to regulatory standards while ensuring the safety of its workforce and minimizing environmental impact.
| Dashboard Type | Primary Audience | Key Metrics | Update Frequency |
| Enterprise Risk | Board, CEO, CRO | Top risks by category, risk appetite status, emerging risk signals | Weekly / real-time for breach alerts |
| Operational Risk | COO, Operations leaders, Risk managers | Loss events, KRI status, RCSA results, control effectiveness | Daily / real-time |
| Cyber / IT Risk | CISO, IT Risk team | Threat indicators, vulnerability status, control test results, incident count | Real-time |
| Compliance Risk | CCO, Compliance team | Obligation status, audit findings, policy adherence, regulatory deadlines | Daily / real-time |
| Third-Party Risk | TPRM team, CPO | Vendor risk scores, assessment status, contract renewals, concentration risk | Weekly / event-driven |
| ESG Risk | CSO, Board ESG committee | Climate metrics, ESG reporting compliance, supply chain standards | Monthly / quarterly |
What KPIs Should be Included in the Risk Management Dashboard?
A risk management dashboard should include key performance indicators (KPIs) like risk exposure levels, incident response times, compliance adherence rates, risk mitigation effectiveness, and the financial impact of risks.
Here are some essential KPIs that need to be included in a risk management dashboard:
- Risk Exposure Levels These levels are fundamental KPIs that provide a snapshot of the organization's current risk landscape. They help in identifying the severity and probability of potential risks affecting various parts of the business. By understanding risk exposure levels, you can prioritize mitigation efforts and allocate resources where they are most needed. This KPI is crucial for maintaining a balanced risk appetite and ensuring that the organization does not exceed its risk tolerance.
- Incident Response Times The speed at which your organization can respond to incidents is a critical measure of your risk management effectiveness. Incident response times indicate how quickly and efficiently your team can address and neutralize threats. This KPI not only reflects your operational readiness but also helps in identifying bottlenecks in your response processes.
- Compliance Adherence Rates Compliance adherence rates measure how well your organization conforms to industry regulations and internal policies. By tracking this KPI, you can identify areas where your organization may be at risk of non-compliance, which can lead to legal and financial penalties. High compliance adherence rates indicate robust governance practices and enhance stakeholder confidence.
- Risk Mitigation Effectiveness This KPI evaluates the success of your risk mitigation strategies in reducing or eliminating risks. It involves assessing the outcomes of implemented controls and determining whether they achieve the desired risk reduction. By measuring mitigation effectiveness, you can refine your strategies, ensuring that they remain aligned with evolving risk profiles and business objectives. A high effectiveness rate indicates that your risk management initiatives are delivering value and protecting organizational assets.
- Financial Impact of Risks This measures the actual or potential financial loss resulting from identified risks, helping you assess the economic impact on your organization. By quantifying the financial impact, you can prioritize risks that require immediate attention and develop cost-effective mitigation plans. This KPI is vital for aligning risk management with financial performance and safeguarding the organization’s bottom line.
| KPI Category | KPI Name | What It Measures | Why It Matters |
| Risk Exposure | Risk Exposure Level | Current risk score vs. appetite threshold by category | Indicates whether risk is within acceptable boundaries |
| Incident Response | Incident Response Time | Average hours from detection to containment | Measures operational readiness to respond to risk events |
| Control Effectiveness | Control Pass Rate | % of controls passing latest test | Indicates whether risk mitigations are functioning |
| Compliance | Compliance Adherence Rate | % of obligations currently met | Indicates overall regulatory compliance posture |
| Issue Management | Open Issues Age | Average days for open risk issues to be resolved | Identifies bottlenecks in risk remediation |
| KRI Monitoring | KRI Breach Rate | % of KRIs currently in amber or red status | Early warning of escalating risk conditions |
How to Design a Risk Management Dashboard?
Designing a risk management dashboard is a key requirement as it ensures your dashboard becomes an indispensable tool for informed decision-making. Here are the steps to follow:
- Define the Purpose and Scope: Begin by identifying the primary purpose of your dashboard. Is it to monitor specific risks, track compliance, or provide an overview of all risk-related activities? Understanding the scope will help you determine what data to include and how to organize it.
- Identify Key Stakeholders: Determine who will be using the dashboard. Is it designed for executives, risk managers, or operational teams? Each group may require different levels of detail and types of information. Engage with stakeholders to understand their needs and expectations, ensuring the dashboard caters to all intended users.
- Select Relevant Metrics and KPIs: Once you know your audience and purpose, select the key performance indicators (KPIs) that best reflect the risk environment. Metrics should be actionable, timely, and aligned with your organization's risk management strategy. Consider using a balanced mix of qualitative and quantitative data to provide a comprehensive view.
- Choose the Right Data Sources: A robust risk management dashboard pulls information from multiple sources. Ensure the data you choose is accurate, reliable, and up-to-date. Establish a system for data integration and validation to maintain the integrity of the information displayed on your dashboard.
- Design with Clarity and Usability: Simplicity is key when designing a dashboard. Avoid clutter by focusing on the most critical information and presenting it in an easy-to-understand format. Use visual elements such as charts, graphs, and heatmaps to make data interpretation intuitive. Maintain consistency in color schemes and fonts to enhance readability.
- Ensure Interactivity and Flexibility: A static dashboard limits user engagement. Incorporate interactive elements that allow users to drill down into data for more detailed insights. The ability to customize views based on specific user needs can greatly improve the dashboard's utility.
- Prioritize Security and Privacy: Risk management dashboards often contain sensitive information. Implement robust security measures to protect data integrity and user privacy. Ensure access is controlled and that users only see information relevant to their roles.
- Test and Refine: Before full deployment, test your dashboard with a pilot group to gather feedback. Identify any issues with data accuracy, usability, or layout, and make necessary adjustments. Regularly update and refine the dashboard based on user feedback and evolving risk landscapes.
- Train Users Across Teams: Provide comprehensive training for users to maximize the dashboard's potential. Ensure they understand how to navigate the interface, interpret data, and generate reports. Continuous education helps maintain high engagement and utilization rates.
- Monitor and Evaluate Performance: Post-implementation, continuously monitor the dashboard's performance. Gather user feedback and assess whether it meets the objectives established at the outset. Regular evaluations ensure the dashboard evolves in tandem with organizational needs and technological advancements.
name="Testing and Iteration">
| Design Consideration | What to Keep in Mind | Common Mistakes to Avoid |
| Purpose and Audience | Define whether the dashboard serves the board, CRO, or operational teams before selecting any metrics. Each audience requires a different level of detail and a different set of KPIs. | Building a single dashboard that tries to serve all audiences simultaneously, resulting in a display too complex for strategic use and too granular for executive decision-making. |
| KPI Selection | Choose metrics that drive decisions, not metrics that are simply available. Every KPI on the dashboard should have a named owner and a defined threshold that triggers action. | Overloading the dashboard with every available data point, which dilutes attention and makes it harder to identify what actually requires a response. |
| Data Integration | Ensure all data sources, including risk registers, control testing results, KRI feeds, and incident logs, are connected and validated before the dashboard goes live. | Allowing manual data entry into the dashboard at any point in the workflow. Manual inputs introduce errors and create a false picture of current risk status. |
| Visual Clarity | Use color coding, threshold indicators, and drill-down capability to surface the most important information immediately. Consistency in layout and color scheme across all views reduces cognitive load. | Using too many chart types or inconsistent color conventions across sections, which forces users to relearn the visual language every time they navigate to a new section. |
| Alert and Escalation Design | Define threshold breach levels (amber and red) for every KPI before deployment. Ensure alerts route automatically to the named metric owner with a clear escalation path. | Setting thresholds too loosely, generating alert fatigue, or setting them too tightly, suppressing alerts that should have triggered a response. Both failures erode trust in the dashboard over time. |
| Governance and Ownership | Assign a named owner to every metric and establish a regular review cadence at both operational and executive levels. Document the escalation process for threshold breaches. | Treating the dashboard as a technology deployment rather than an ongoing governance function. Without named ownership, dashboards degrade as data becomes stale and no one investigates alerts. |
| Security and Access Control | Role-based access should be configured from the outset so users see only the information relevant to their function. Sensitive risk data should never be accessible to all users by default. | Applying uniform access permissions across all user groups for the sake of simplicity, exposing sensitive board-level or regulatory data to users who have no need to see it. |
| Testing and Iteration | Pilot the dashboard with a representative group of intended users before full deployment. Gather structured feedback on usability, data accuracy, and whether the metrics displayed match actual decision-making needs. | Launching the full dashboard without a pilot phase and discovering usability or data quality issues only after the dashboard is embedded in governance processes, making corrections far more disruptive. |
Conclusion
An effectively designed risk management dashboard is an indispensable asset for any organization seeking to enhance its risk oversight capabilities.
MetricStream understands the complexities and nuances involved in building such important tools. Our range of software solutions, including asolutions, are designed to help organizations seamlessly integrate robust risk management practices into their operations. This includes providing a 360º view of risk and trends through interactive dashboards and advanced visualization of key metrics to help you respond faster to emerging risks or changing risk profiles. Whether you are looking to build your first risk management dashboard or enhance an existing one, MetricStream offers the expertise and technology needed to achieve your goals with confidence and clarity.
A risk management dashboard is a centralized digital platform that visually displays an organization's critical risk metrics, enabling decision-makers to monitor, assess, and act on risk exposure across all business domains in real time. The dashboard consolidates data from multiple sources, including risk registers, control testing systems, KRI feeds, and incident logs, into charts, heat maps, and tables that provide a continuously updated view of the organization's risk posture.
Today's organizations are inundated with data, from internal operations to external market dynamics. What’s often overlooked, though, is how this data is processed and translated into decision-making power.
According to Forrester's The State of Enterprise Risk Management 2025, firms without board-level ERM visibility were 20% more likely to suffer six or more critical risk events in a year. The pressure isn't confined to managing risks but rather about sifting through noise to identify what matters. With countless variables impacting performance, finance, or compliance, the challenge is understanding which insights require action and which can be set aside. The complexity can overwhelm even the most experienced leadership, leading to decisions based on guesswork instead of grounded insights.
In the chaos of daily operations, leaders need a clear, real-time view of how their decisions impact both short-term objectives and long-term goals. What’s needed is an organized, intuitive approach to visualizing risks and opportunities - something that pulls everything into a single, actionable source of truth, enabling smart decisions that drive both stability and growth.
A risk management dashboard is a centralized platform that visually displays critical risk metrics, offering decision-makers a clear view of their risk landscape.
Why Do You Need a Risk Management Dashboard: A dashboard uncovers hidden risks, provides data-driven insights, improves accountability, and enables the effective allocation of resources. It also simplifies compliance and enhances collaboration across teams.
KPIs: KPIs like risk exposure levels, incident response times, and compliance adherence rates help organizations prioritize risks and measure the effectiveness of their mitigation strategies, ensuring that their efforts align with business goals.
How to Design a Risk Management Dashboard: Designing an effective dashboard involves defining its purpose, selecting relevant KPIs, integrating reliable data, and ensuring usability. Security, interactivity, and ongoing evaluation are also essential components to maintain its functionality.
A risk management dashboard is a tool designed to provide an at-a-glance overview of an organization's risk landscape, enabling decision-makers to monitor, assess, and mitigate risks efficiently. It consolidates data from various sources, offering a centralized platform that visually represents critical risk metrics and key performance indicators (KPIs).
By presenting data in an easily digestible format through charts, graphs, and tables, risk management dashboards help enhance transparency and communication across departments, ultimately supporting the organization's strategic goals.
As businesses face complex risks, having the right tools to track, assess, and act becomes crucial. The following are the key reasons why a risk management dashboard is the solution that bridges awareness with action.
- Uncover Hidden Risks Before They Escalate A risk management dashboard provides real-time visibility into emerging risks that might otherwise go unnoticed. By aggregating data from various sources, you can quickly detect patterns and trends that may pose future threats to your organization. Early identification enables timely intervention, preventing minor issues from escalating into major crises.
- Act on Data-Driven Insights with Confidence With a comprehensive view of risks and their potential impact, a dashboard empowers decision-makers to act based on solid, data-backed insights. Instead of relying on gut feelings or fragmented reports, leadership teams can assess the probability and consequences of each risk, leading to more informed and strategic choices across departments.
- Improve Accountability A risk management dashboard ensures that responsibilities are clearly defined and assigned. When risks are visible to all relevant stakeholders, there is greater accountability. Teams can track mitigation efforts, follow progress, and ensure that all departments are aligned on risk-related goals. This, in turn, drives collaboration and ensures that everyone knows their role in managing risks.
- Allocate Resources Where They're Needed Most Having a holistic view of risk exposure allows organizations to allocate resources more effectively. A dashboard helps prioritize which areas require the most attention, ensuring that time, budget, and personnel are focused on mitigating the highest risks first. This targeted approach enhances operational efficiency by addressing the most critical vulnerabilities head-on.
- Simplify Compliance and Regulatory Reporting For industries operating within strict regulatory requirements, a risk management dashboard can significantly ease the burden of compliance. By providing detailed, up-to-date reports on how risks are managed, the dashboard can simplify audits and ensure adherence to various standards. This reduces the administrative strain of manual reporting and ensures that the organization stays compliant without any added complexity.
Let's explore examples of how risk management dashboards are implemented across different sectors, illustrating their versatility in mitigating risks:
- In the manufacturing industry, a risk management dashboard might track and analyze risks associated with supply chain disruptions. For example, such a dashboard could display metrics related to supplier performance, delivery timelines, and geopolitical factors that may affect raw material availability. By providing an overview of these variables, the dashboard enables manufacturers to identify potential supply chain bottlenecks and devise contingency plans to ensure uninterrupted production.
- In another scenario, consider a technology firm that is heavily invested in cybersecurity. Its risk management dashboard aggregates data from various security systems, highlighting potential threats and vulnerabilities. The dashboard provides visualizations of ongoing cyber threats, categorizes them based on severity, and tracks the response actions taken. This enables the IT security team to prioritize threats, manage incident responses effectively, and ensure compliance with regulatory standards. Furthermore, the dashboard aids in assessing the effectiveness of the implemented security measures over time, supporting continuous improvement in the company's cybersecurity posture.
- In the energy sector, companies dealing with oil and gas extraction could benefit from a risk management dashboard that monitors environmental risks and compliance with safety regulations. This dashboard might track data related to weather patterns, equipment maintenance schedules, and safety incidents to predict and mitigate potential hazards. By providing an integrated view of these risks, the dashboard helps the company adhere to regulatory standards while ensuring the safety of its workforce and minimizing environmental impact.
| Dashboard Type | Primary Audience | Key Metrics | Update Frequency |
| Enterprise Risk | Board, CEO, CRO | Top risks by category, risk appetite status, emerging risk signals | Weekly / real-time for breach alerts |
| Operational Risk | COO, Operations leaders, Risk managers | Loss events, KRI status, RCSA results, control effectiveness | Daily / real-time |
| Cyber / IT Risk | CISO, IT Risk team | Threat indicators, vulnerability status, control test results, incident count | Real-time |
| Compliance Risk | CCO, Compliance team | Obligation status, audit findings, policy adherence, regulatory deadlines | Daily / real-time |
| Third-Party Risk | TPRM team, CPO | Vendor risk scores, assessment status, contract renewals, concentration risk | Weekly / event-driven |
| ESG Risk | CSO, Board ESG committee | Climate metrics, ESG reporting compliance, supply chain standards | Monthly / quarterly |
A risk management dashboard should include key performance indicators (KPIs) like risk exposure levels, incident response times, compliance adherence rates, risk mitigation effectiveness, and the financial impact of risks.
Here are some essential KPIs that need to be included in a risk management dashboard:
- Risk Exposure Levels These levels are fundamental KPIs that provide a snapshot of the organization's current risk landscape. They help in identifying the severity and probability of potential risks affecting various parts of the business. By understanding risk exposure levels, you can prioritize mitigation efforts and allocate resources where they are most needed. This KPI is crucial for maintaining a balanced risk appetite and ensuring that the organization does not exceed its risk tolerance.
- Incident Response Times The speed at which your organization can respond to incidents is a critical measure of your risk management effectiveness. Incident response times indicate how quickly and efficiently your team can address and neutralize threats. This KPI not only reflects your operational readiness but also helps in identifying bottlenecks in your response processes.
- Compliance Adherence Rates Compliance adherence rates measure how well your organization conforms to industry regulations and internal policies. By tracking this KPI, you can identify areas where your organization may be at risk of non-compliance, which can lead to legal and financial penalties. High compliance adherence rates indicate robust governance practices and enhance stakeholder confidence.
- Risk Mitigation Effectiveness This KPI evaluates the success of your risk mitigation strategies in reducing or eliminating risks. It involves assessing the outcomes of implemented controls and determining whether they achieve the desired risk reduction. By measuring mitigation effectiveness, you can refine your strategies, ensuring that they remain aligned with evolving risk profiles and business objectives. A high effectiveness rate indicates that your risk management initiatives are delivering value and protecting organizational assets.
- Financial Impact of Risks This measures the actual or potential financial loss resulting from identified risks, helping you assess the economic impact on your organization. By quantifying the financial impact, you can prioritize risks that require immediate attention and develop cost-effective mitigation plans. This KPI is vital for aligning risk management with financial performance and safeguarding the organization’s bottom line.
| KPI Category | KPI Name | What It Measures | Why It Matters |
| Risk Exposure | Risk Exposure Level | Current risk score vs. appetite threshold by category | Indicates whether risk is within acceptable boundaries |
| Incident Response | Incident Response Time | Average hours from detection to containment | Measures operational readiness to respond to risk events |
| Control Effectiveness | Control Pass Rate | % of controls passing latest test | Indicates whether risk mitigations are functioning |
| Compliance | Compliance Adherence Rate | % of obligations currently met | Indicates overall regulatory compliance posture |
| Issue Management | Open Issues Age | Average days for open risk issues to be resolved | Identifies bottlenecks in risk remediation |
| KRI Monitoring | KRI Breach Rate | % of KRIs currently in amber or red status | Early warning of escalating risk conditions |
Designing a risk management dashboard is a key requirement as it ensures your dashboard becomes an indispensable tool for informed decision-making. Here are the steps to follow:
- Define the Purpose and Scope: Begin by identifying the primary purpose of your dashboard. Is it to monitor specific risks, track compliance, or provide an overview of all risk-related activities? Understanding the scope will help you determine what data to include and how to organize it.
- Identify Key Stakeholders: Determine who will be using the dashboard. Is it designed for executives, risk managers, or operational teams? Each group may require different levels of detail and types of information. Engage with stakeholders to understand their needs and expectations, ensuring the dashboard caters to all intended users.
- Select Relevant Metrics and KPIs: Once you know your audience and purpose, select the key performance indicators (KPIs) that best reflect the risk environment. Metrics should be actionable, timely, and aligned with your organization's risk management strategy. Consider using a balanced mix of qualitative and quantitative data to provide a comprehensive view.
- Choose the Right Data Sources: A robust risk management dashboard pulls information from multiple sources. Ensure the data you choose is accurate, reliable, and up-to-date. Establish a system for data integration and validation to maintain the integrity of the information displayed on your dashboard.
- Design with Clarity and Usability: Simplicity is key when designing a dashboard. Avoid clutter by focusing on the most critical information and presenting it in an easy-to-understand format. Use visual elements such as charts, graphs, and heatmaps to make data interpretation intuitive. Maintain consistency in color schemes and fonts to enhance readability.
- Ensure Interactivity and Flexibility: A static dashboard limits user engagement. Incorporate interactive elements that allow users to drill down into data for more detailed insights. The ability to customize views based on specific user needs can greatly improve the dashboard's utility.
- Prioritize Security and Privacy: Risk management dashboards often contain sensitive information. Implement robust security measures to protect data integrity and user privacy. Ensure access is controlled and that users only see information relevant to their roles.
- Test and Refine: Before full deployment, test your dashboard with a pilot group to gather feedback. Identify any issues with data accuracy, usability, or layout, and make necessary adjustments. Regularly update and refine the dashboard based on user feedback and evolving risk landscapes.
- Train Users Across Teams: Provide comprehensive training for users to maximize the dashboard's potential. Ensure they understand how to navigate the interface, interpret data, and generate reports. Continuous education helps maintain high engagement and utilization rates.
- Monitor and Evaluate Performance: Post-implementation, continuously monitor the dashboard's performance. Gather user feedback and assess whether it meets the objectives established at the outset. Regular evaluations ensure the dashboard evolves in tandem with organizational needs and technological advancements.
name="Testing and Iteration">
| Design Consideration | What to Keep in Mind | Common Mistakes to Avoid |
| Purpose and Audience | Define whether the dashboard serves the board, CRO, or operational teams before selecting any metrics. Each audience requires a different level of detail and a different set of KPIs. | Building a single dashboard that tries to serve all audiences simultaneously, resulting in a display too complex for strategic use and too granular for executive decision-making. |
| KPI Selection | Choose metrics that drive decisions, not metrics that are simply available. Every KPI on the dashboard should have a named owner and a defined threshold that triggers action. | Overloading the dashboard with every available data point, which dilutes attention and makes it harder to identify what actually requires a response. |
| Data Integration | Ensure all data sources, including risk registers, control testing results, KRI feeds, and incident logs, are connected and validated before the dashboard goes live. | Allowing manual data entry into the dashboard at any point in the workflow. Manual inputs introduce errors and create a false picture of current risk status. |
| Visual Clarity | Use color coding, threshold indicators, and drill-down capability to surface the most important information immediately. Consistency in layout and color scheme across all views reduces cognitive load. | Using too many chart types or inconsistent color conventions across sections, which forces users to relearn the visual language every time they navigate to a new section. |
| Alert and Escalation Design | Define threshold breach levels (amber and red) for every KPI before deployment. Ensure alerts route automatically to the named metric owner with a clear escalation path. | Setting thresholds too loosely, generating alert fatigue, or setting them too tightly, suppressing alerts that should have triggered a response. Both failures erode trust in the dashboard over time. |
| Governance and Ownership | Assign a named owner to every metric and establish a regular review cadence at both operational and executive levels. Document the escalation process for threshold breaches. | Treating the dashboard as a technology deployment rather than an ongoing governance function. Without named ownership, dashboards degrade as data becomes stale and no one investigates alerts. |
| Security and Access Control | Role-based access should be configured from the outset so users see only the information relevant to their function. Sensitive risk data should never be accessible to all users by default. | Applying uniform access permissions across all user groups for the sake of simplicity, exposing sensitive board-level or regulatory data to users who have no need to see it. |
| Testing and Iteration | Pilot the dashboard with a representative group of intended users before full deployment. Gather structured feedback on usability, data accuracy, and whether the metrics displayed match actual decision-making needs. | Launching the full dashboard without a pilot phase and discovering usability or data quality issues only after the dashboard is embedded in governance processes, making corrections far more disruptive. |
An effectively designed risk management dashboard is an indispensable asset for any organization seeking to enhance its risk oversight capabilities.
MetricStream understands the complexities and nuances involved in building such important tools. Our range of software solutions, including asolutions, are designed to help organizations seamlessly integrate robust risk management practices into their operations. This includes providing a 360º view of risk and trends through interactive dashboards and advanced visualization of key metrics to help you respond faster to emerging risks or changing risk profiles. Whether you are looking to build your first risk management dashboard or enhance an existing one, MetricStream offers the expertise and technology needed to achieve your goals with confidence and clarity.
Frequently Asked Questions
A risk management dashboard is a tool that visually presents key risk metrics, helping organizations monitor, assess, and mitigate risks in real time.
Customization ensures that the dashboard reflects the specific risks and priorities of an organization, making the tool very relevant and actionable for stakeholders.
Visual elements include graphs, heat maps, trend lines, and pie charts, which help simplify complex data for easier analysis and decision-making.
A risk management dashboard visualizes overall risk exposure across all categories, including strategic, operational, financial, cyber, and compliance risks, measured against appetite and KRI trends. A compliance dashboard focuses specifically on regulatory adherence, tracking control testing results, audit findings, and policy compliance, and in a Connected GRC platform its data feeds into the broader risk view as one input.
Key KPIs include risk exposure level measured against appetite thresholds, KRI breach rate, control effectiveness rate, incident response time, open issues age, compliance adherence rate, risk appetite utilization, and emerging risk count. Together these indicators give the CRO, board, and operational teams a measurable, real-time view of the organization's risk posture across all domains.
Risk management dashboards are purpose-built for different audiences, ranging from enterprise risk dashboards for boards and CROs to operational, cyber, compliance, and third-party risk dashboards for functional teams. Each type surfaces the metrics most relevant to its audience and updates at a frequency matched to the speed of the risks it monitors.
Designing an effective risk management dashboard requires defining the purpose and audience first, then selecting KPIs that drive decisions rather than simply reflect available data, and integrating validated data sources across risk, control, incident, and regulatory systems. Usability, threshold alerts, drill-down capability, and clear metric ownership governance are equally important to ensure the dashboard remains accurate and actively used after deployment.
Update frequency depends on the risk domain: cyber threat indicators and critical KRIs require real-time updates, control testing results and audit findings suit daily updates, operational risk summaries update weekly, and board-level risk appetite reviews update monthly. A well-designed GRC platform enables different metrics to refresh at different frequencies automatically, eliminating manual data gathering.
A board-level risk dashboard translates complex risk data into the visual, financial language boards need to fulfil their oversight responsibilities, showing top risks against approved appetite, any appetite breaches requiring board-level decisions, and emerging risks identified since the last meeting. This enables boards to move from static quarterly reports to continuous oversight, meeting regulator and investor expectations for active, informed risk governance.
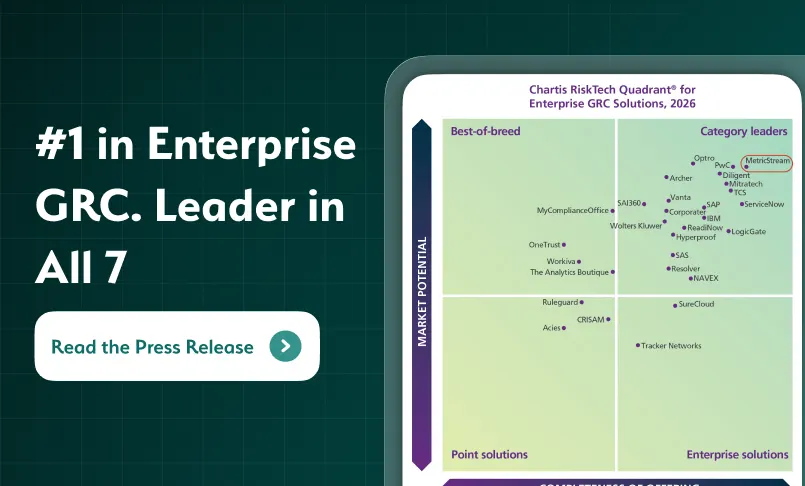
MetricStream's Connected GRC platform provides configurable risk management dashboards built on a unified data architecture that connects risk, compliance, audit, cyber, and third-party data in a single system, with pre-built templates for board, CRO, and operational audiences, automated KRI alerts, and AI-powered insights through AiSPIRE. MetricStream is ranked number one in Operational Risk and Internal Audit by Chartis Research.