Continuous Intelligence
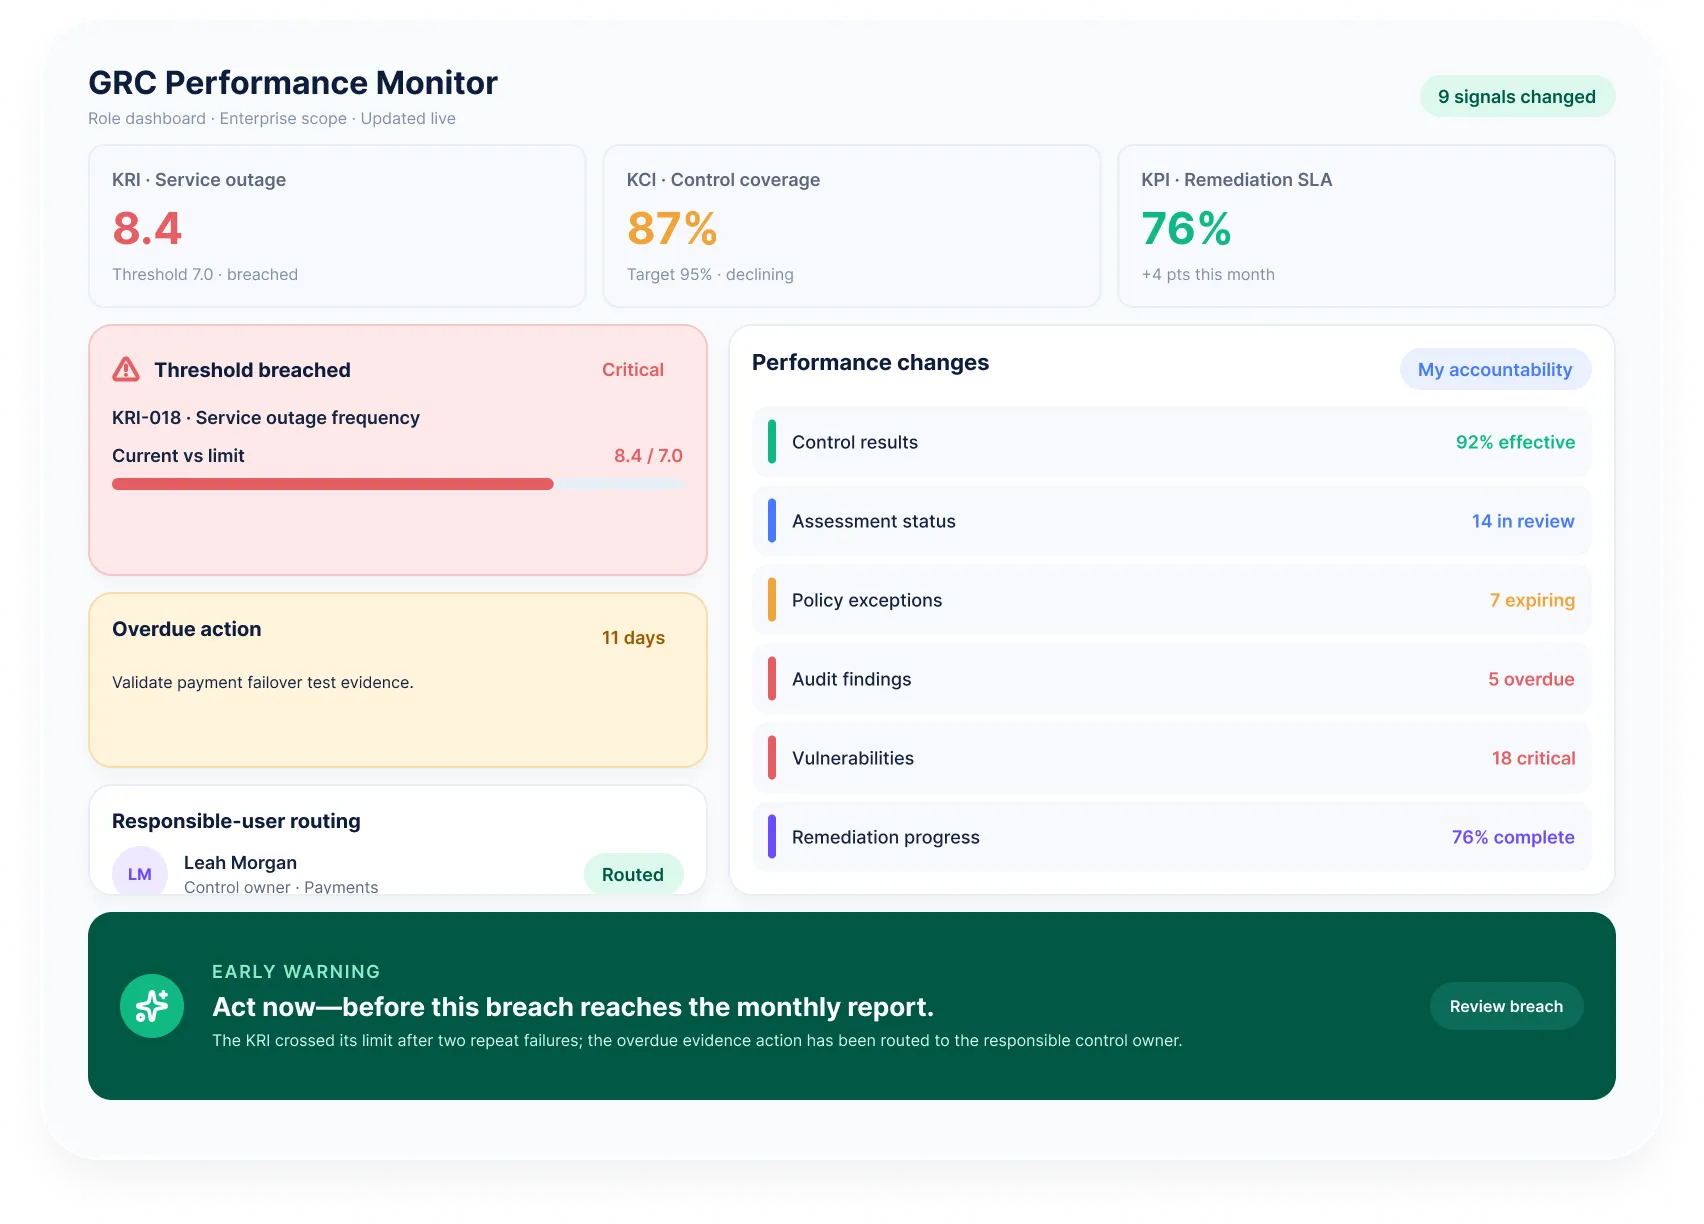
Monitor connected GRC signals, metrics, thresholds, assessments, controls, issues, and actions as conditions change.

Connect real-time risk, compliance, audit, cyber, and third-party data, and use AI to create narratives, recommendations, analytics, dashboards, and decision-ready reporting.
Monitor connected GRC signals, metrics, thresholds, assessments, controls, issues, and actions as conditions change.
Turn complex data into contextual summaries that explain what changed, why it matters, and what to do next
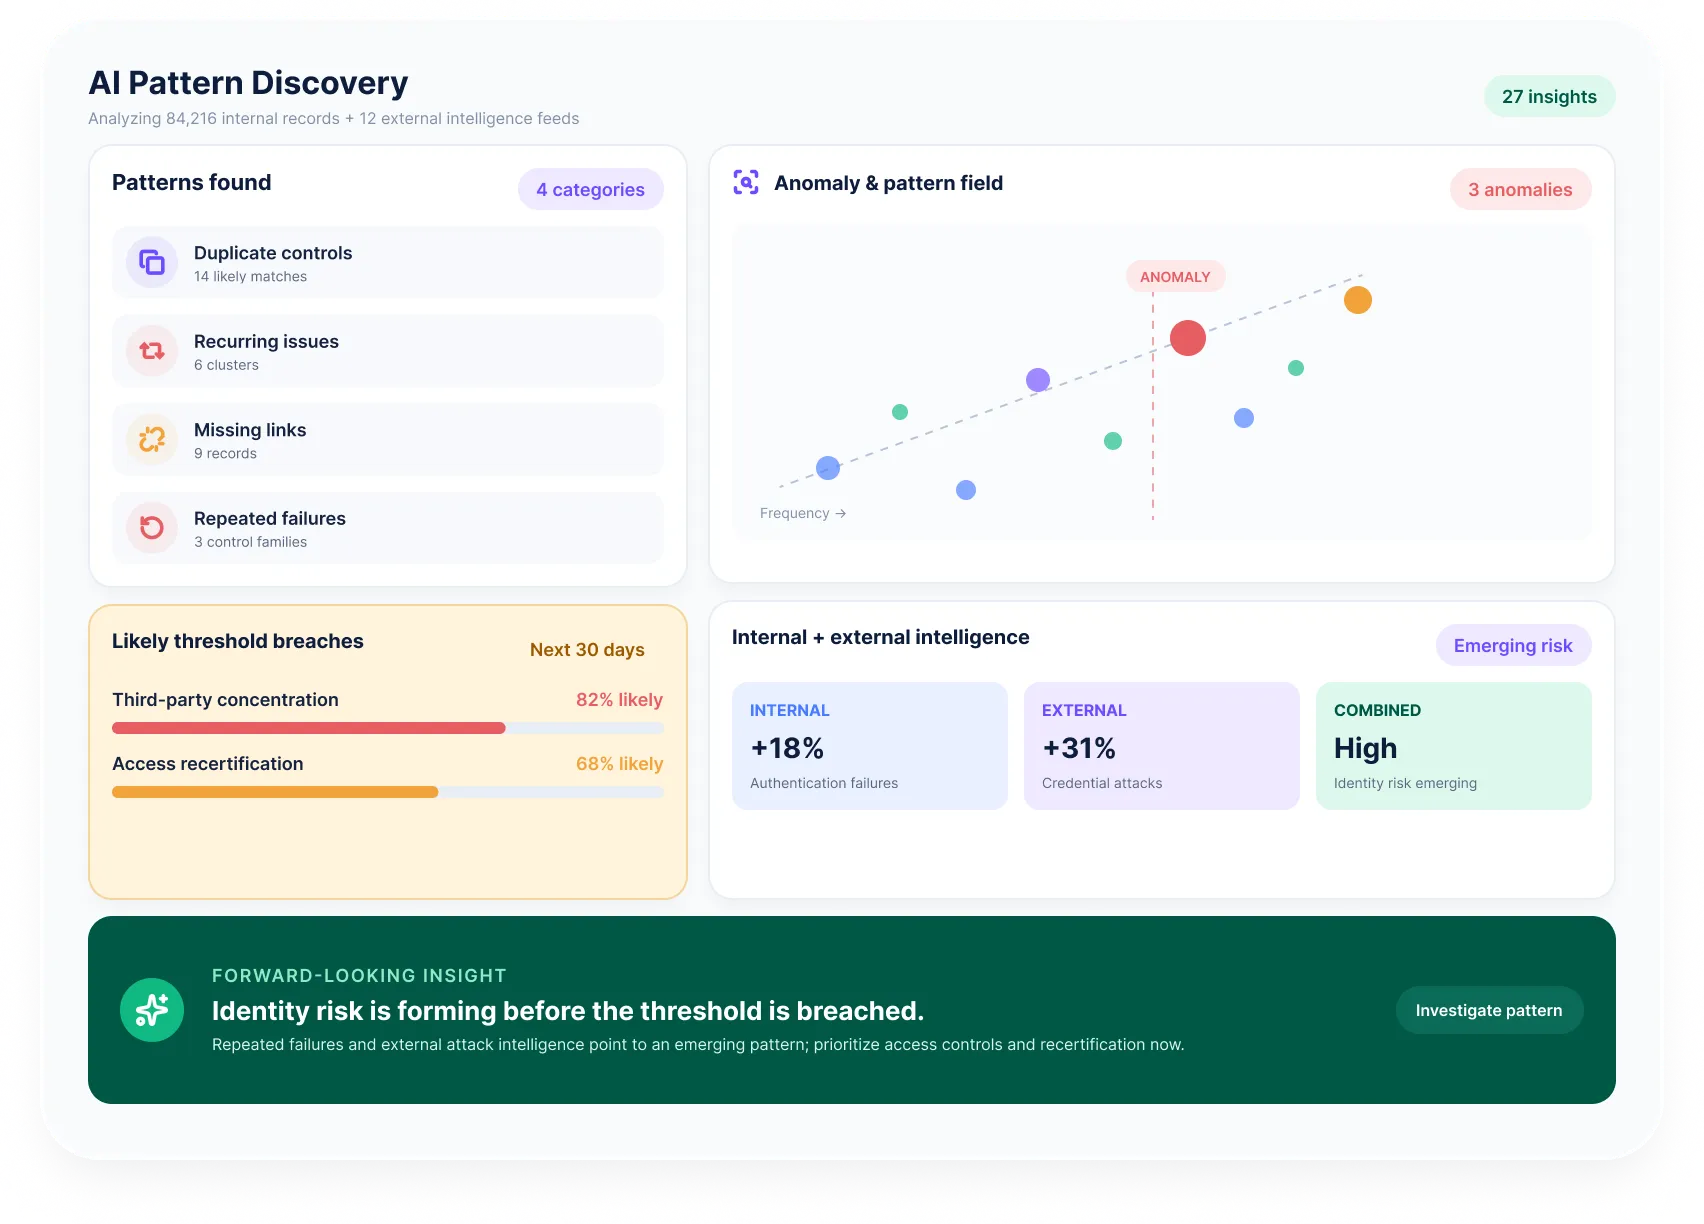
Prioritize risks, controls, issues, and remediation using trends, anomalies, relationships, and business impact.
$4.2M
in avoided GRC-related costs
76%
customer-reported reduction in risks tracked
>50%
customer-reported reduction in controls managed and tested
Source: The Total Economic Impact™ study of MetricStream Enterprise GRC.
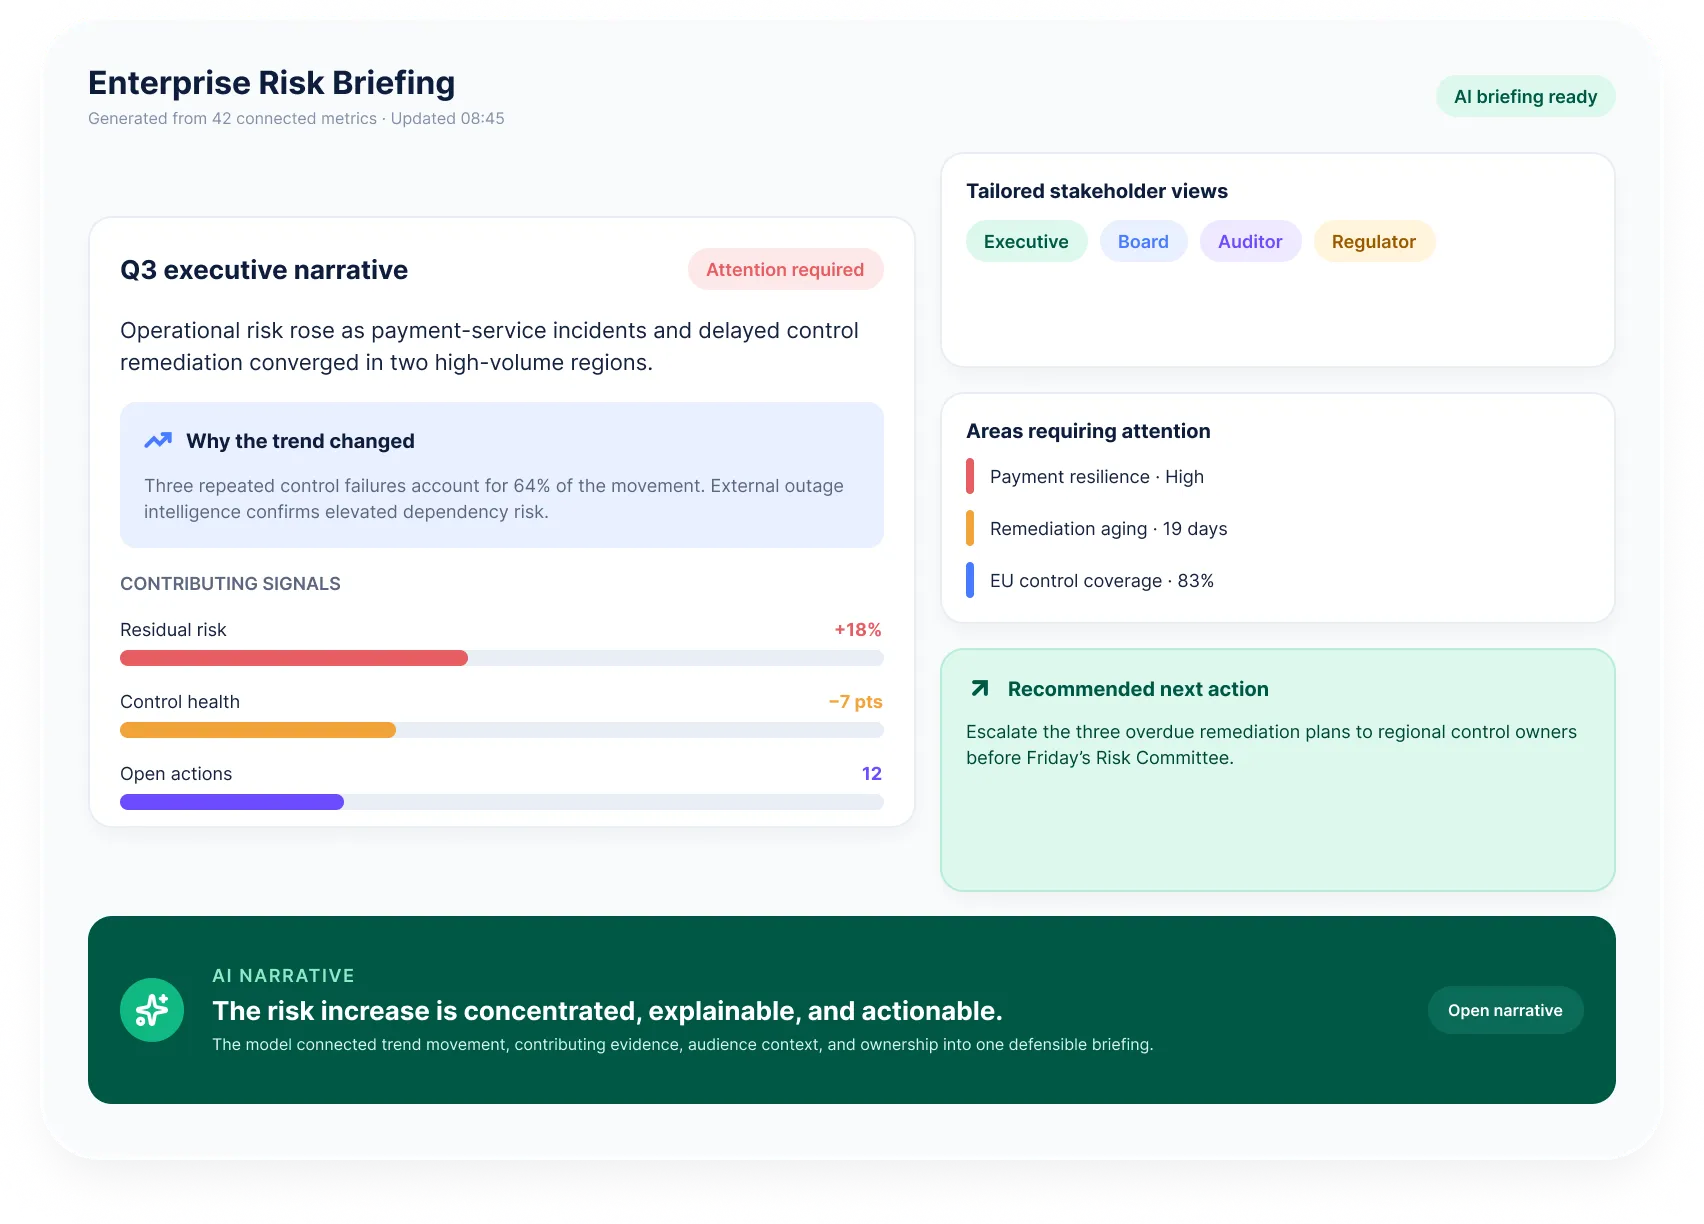
Transform connected metrics into concise, contextual briefings for executives, boards, auditors, and regulators. AI explains trends, connects contributing signals, highlights areas requiring attention, and recommends the next action.
Analytics Capability
Traditional GRC Reporting
MetricStream AI-Native Reporting
Board & Executive Reports
Leaders receive static charts and reports that need to be manually created
AI-enabled narratives bring in real-time data, explain context, and provide recommendations
Data Analysis
Teams interpret isolated reports and spreadsheets
Connected GRC relationships provide context across domains
Monitoring
Risks are reviewed periodically
Dashboards track current metrics, thresholds, status, and change
Analytics & Investigations
Users search multiple systems for supporting details
Drill-downs connect indicators to records, evidence, owners, and actions
Trend Identification
Patterns are found manually after reporting cycles
AI-powered capabilities can identify anomalies, trends, and recurring themes
Reporting Design
IT teams build every new report.
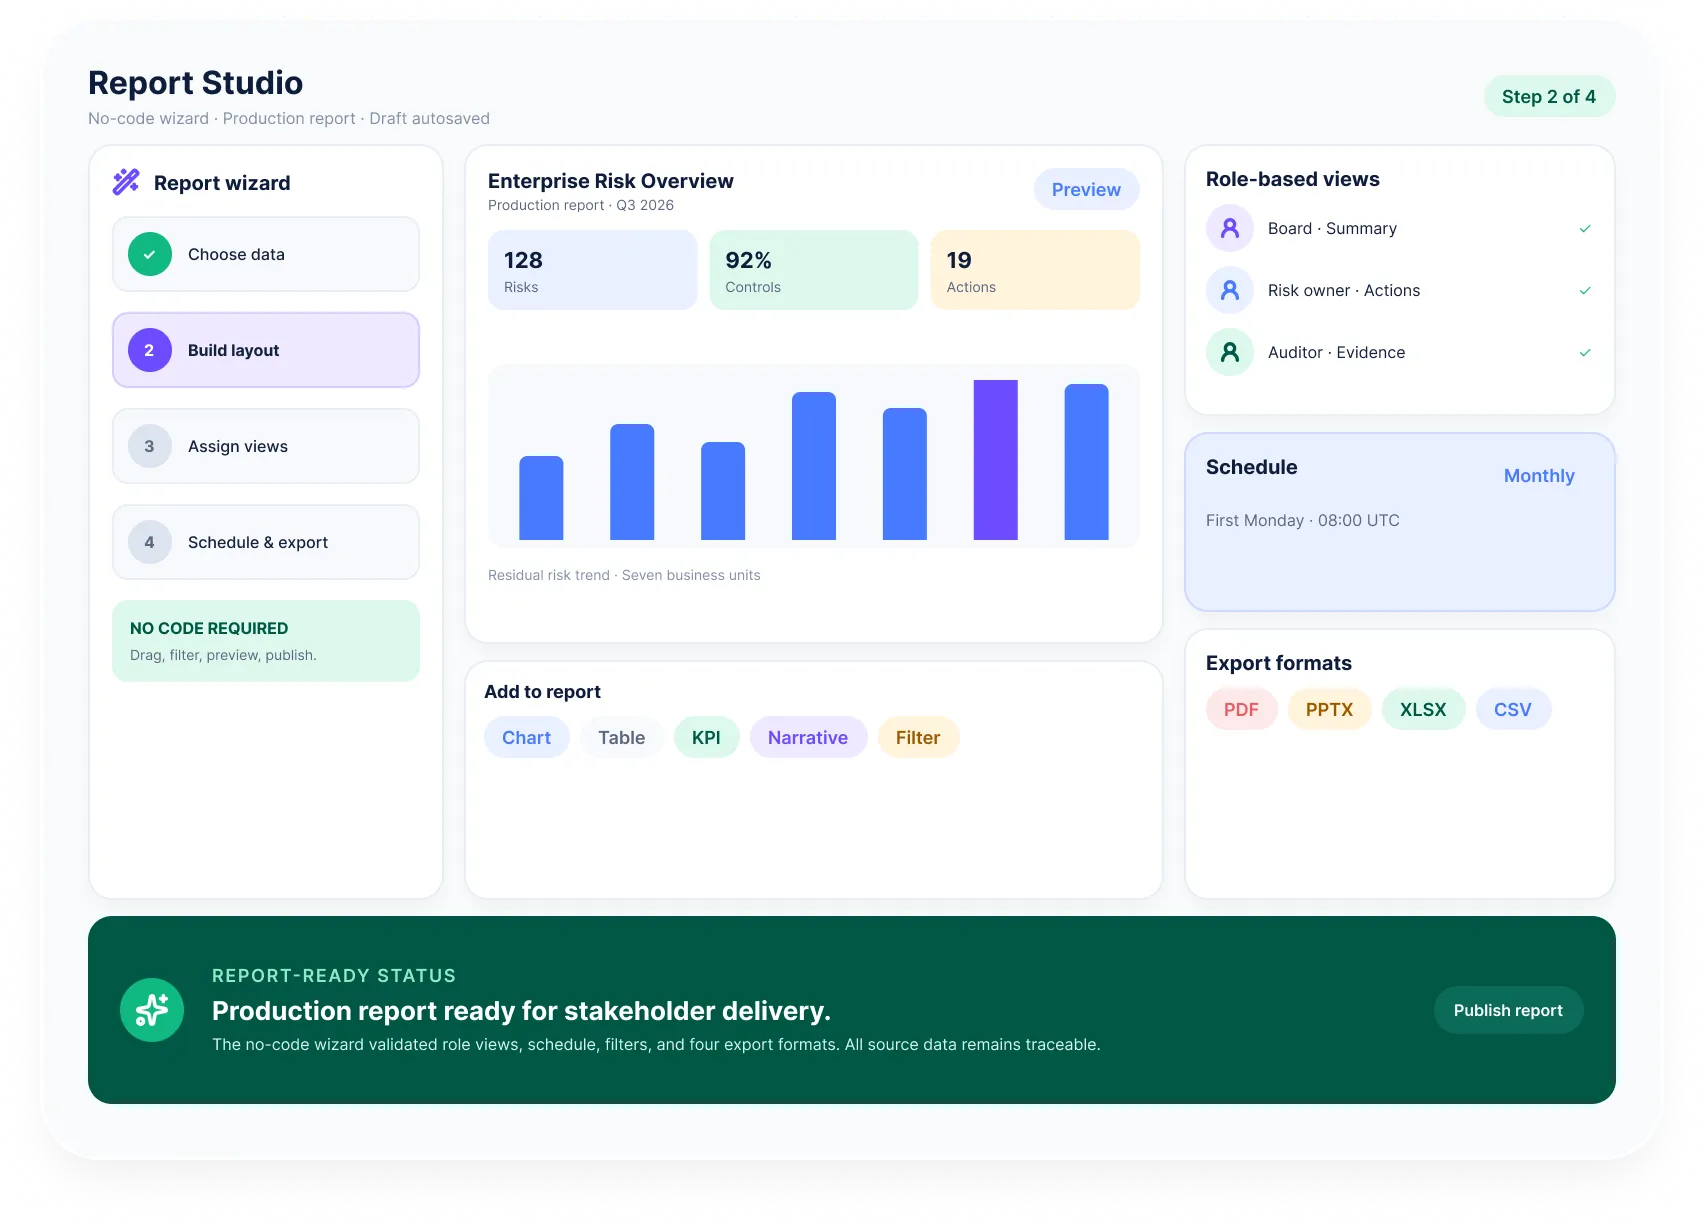
Authorized users create configurable reports and views without coding
Business Intelligence
Manually export data and work with BI experts to create reports and dashboards
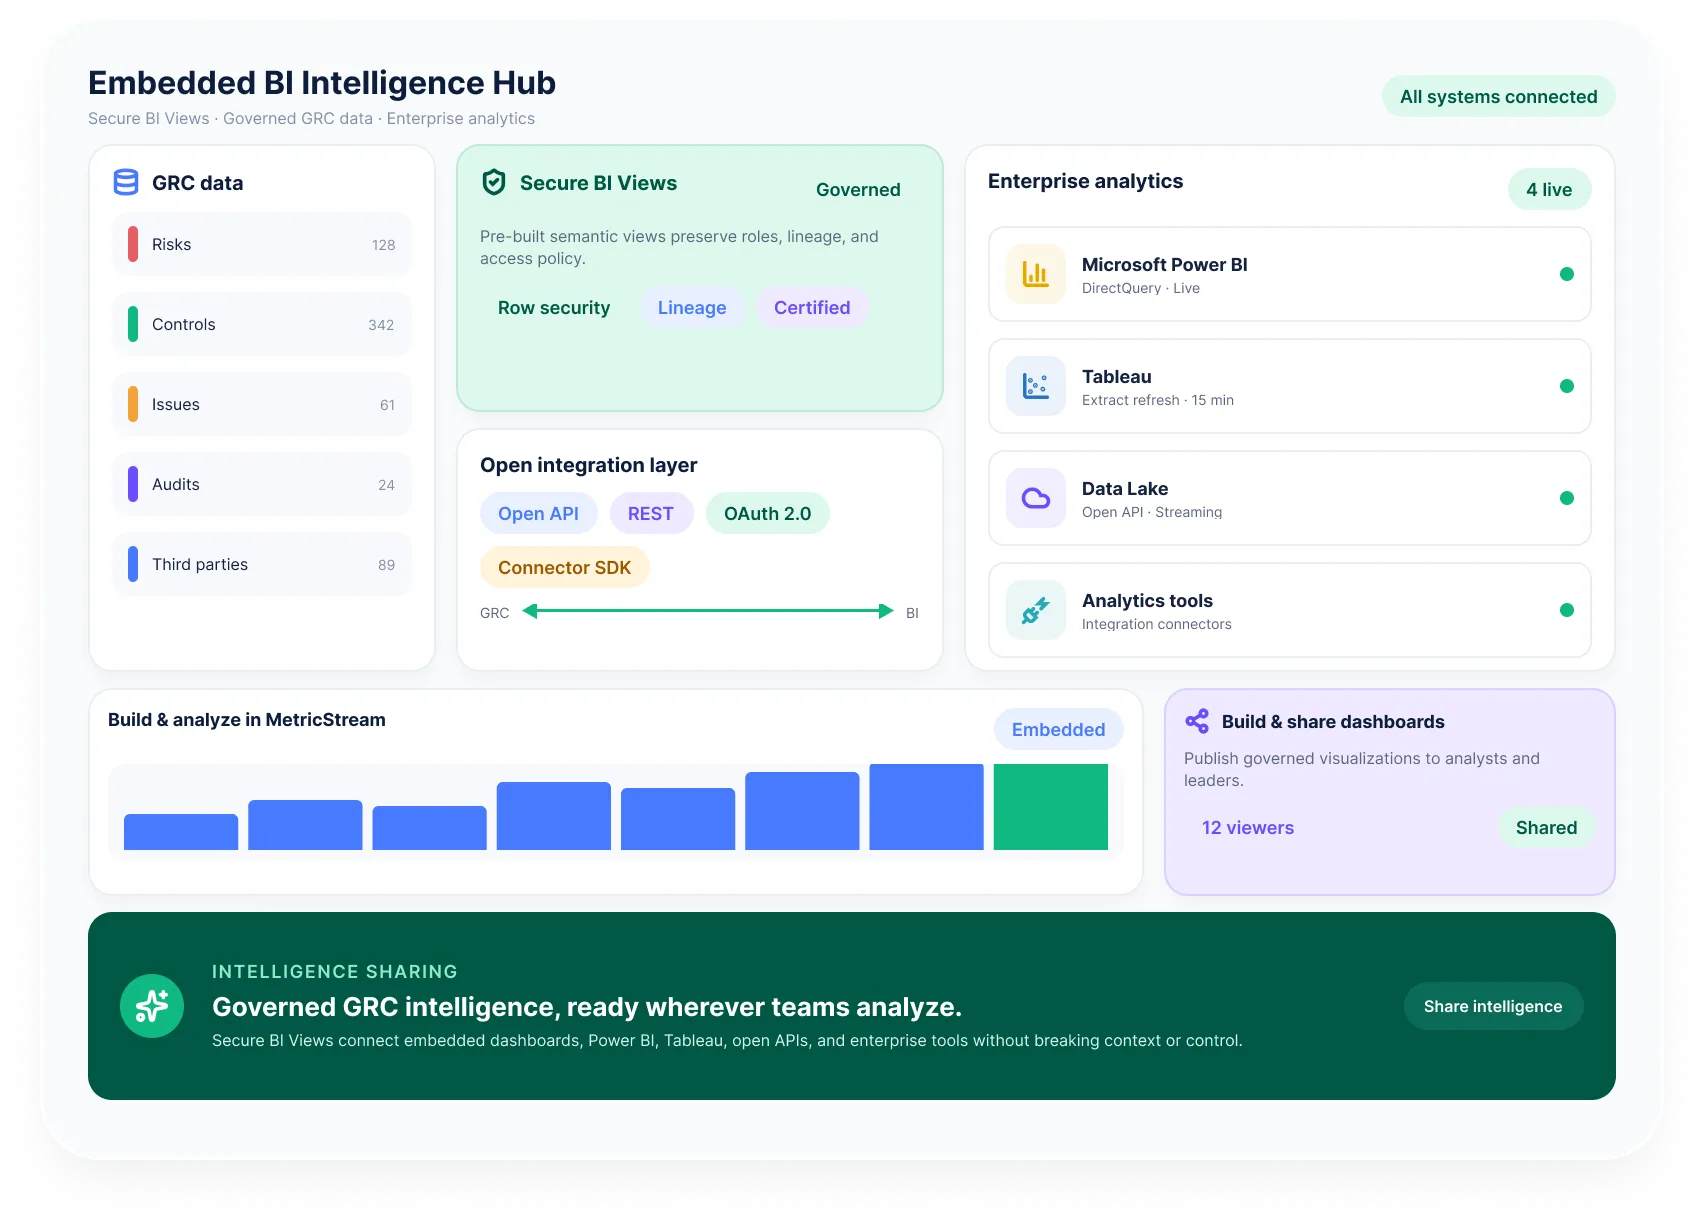
Embedded Business Intelligence and the flexibility to connect and use enterprise BI tools
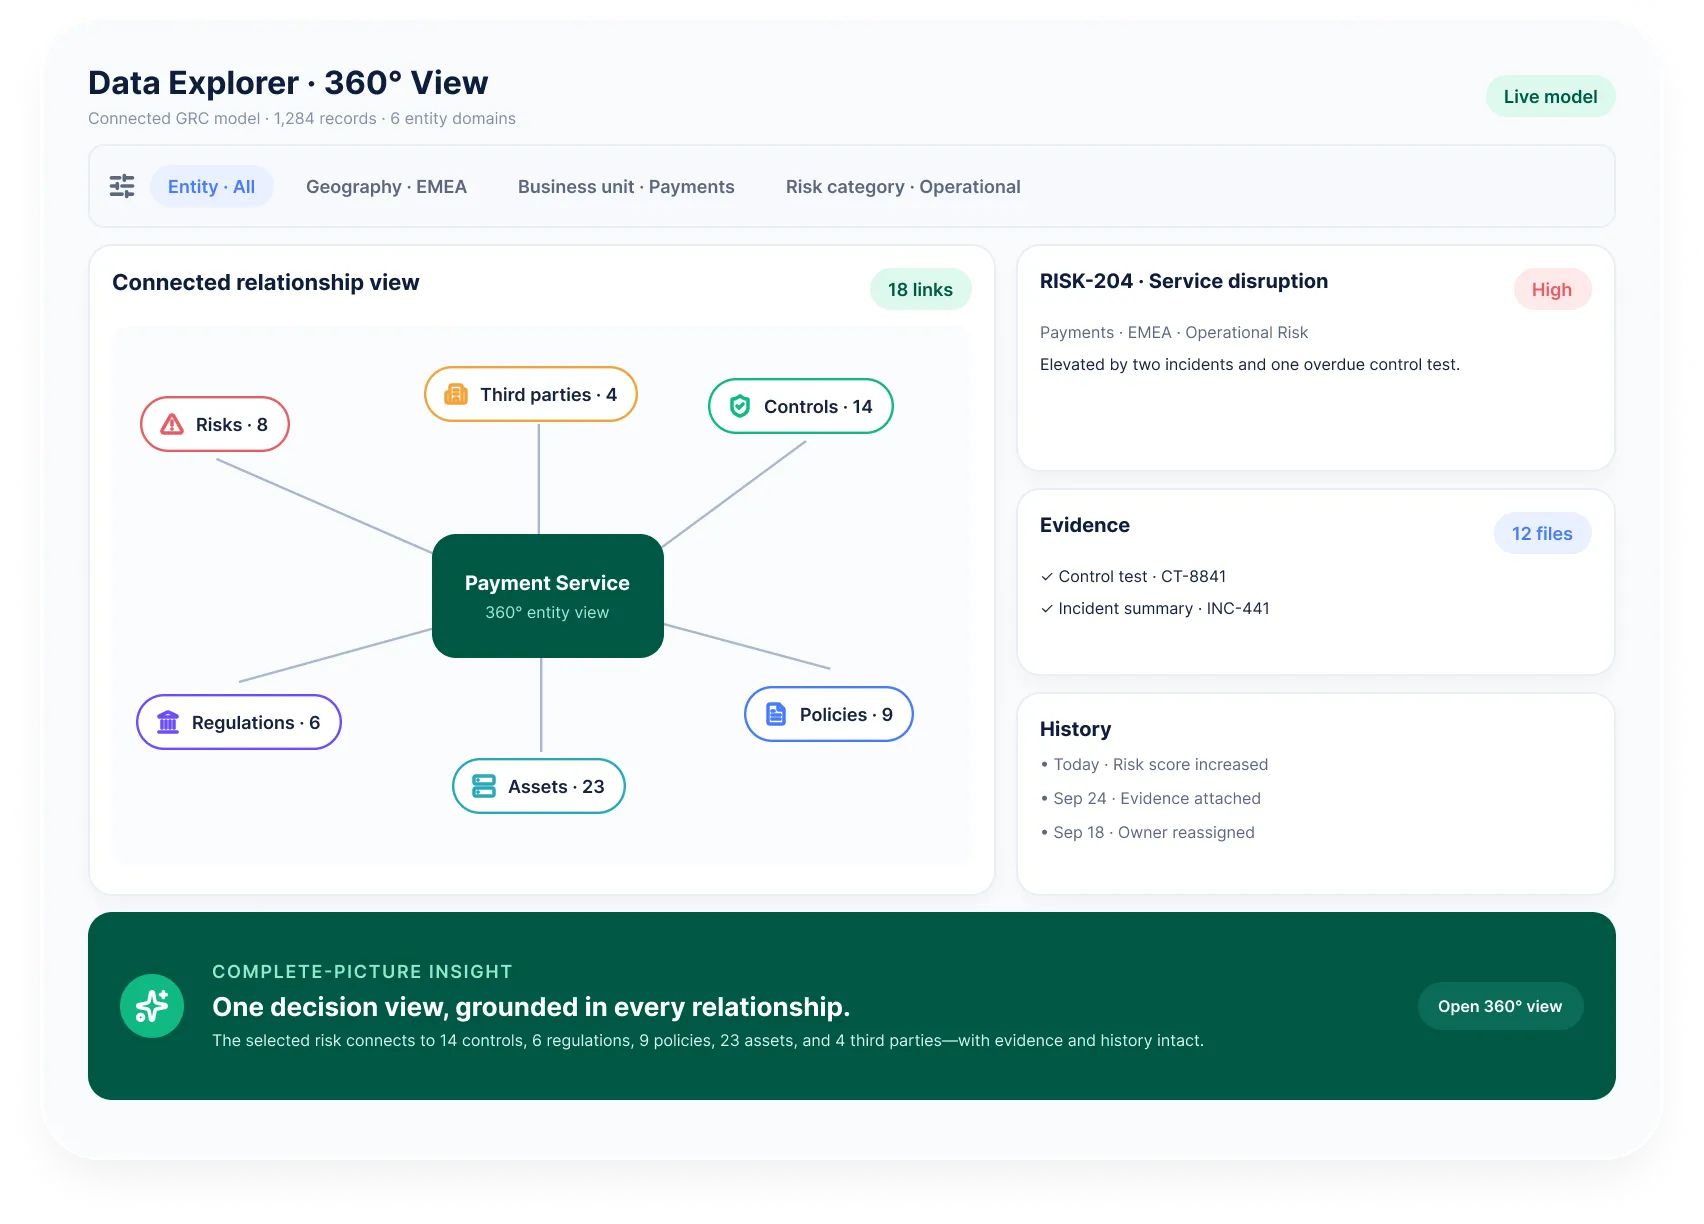
Analyze relationships across GRC domains rather than interpreting isolated charts and datasets.

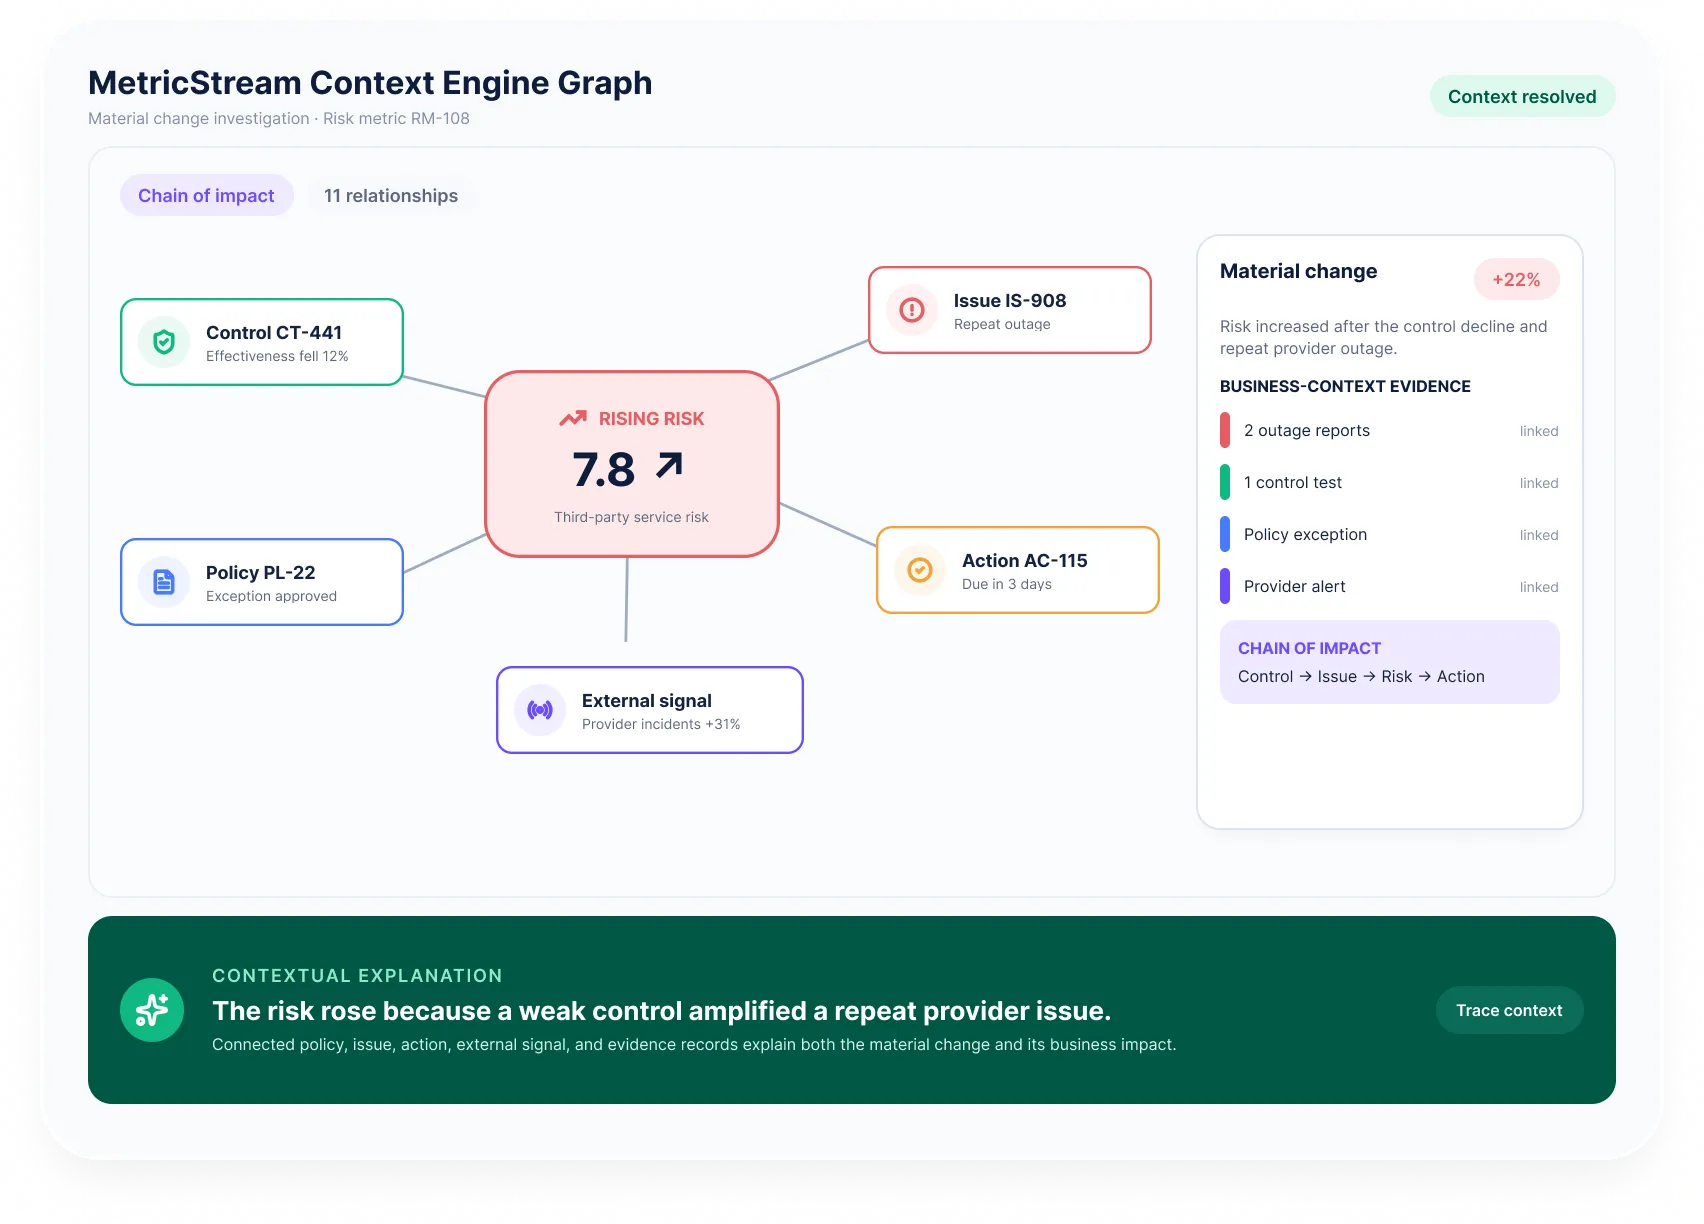
Understand the story behind the numbers with summaries, trends, contributing factors, and recommendations.

Give boards, executives, program leaders, control owners, and frontline users the right level of detail.
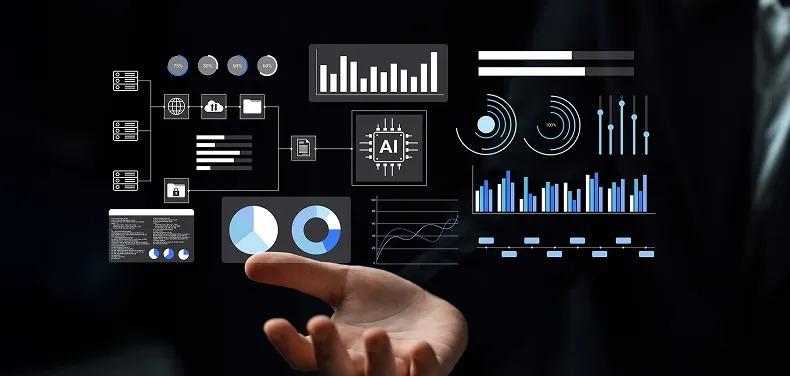
Create and adapt reports without depending on technical teams for every change.

Flexibility to either use Embedded BI or connect to Power BI, Tableau, and other enterprise BI tools using BI Views

Drill from every high-level indicator into sourced records, evidence, ownership, decisions, and actions.
Use our interactive ROI calculator, built by Forrester, to estimate what Enterprise GRC could deliver for your organization. Enter details such as annual revenue, number of GRC tools, and compliance exposure to see your potential savings, payback period, and return on investment.
Calculate My ROI
Analyst Report
New Forrester TEI Study: 133% ROI, $8.4M in benefits from MetricStream Enterprise GRC. Read now.
Download Now
eBook
A CISO's guide to outsmarting cyber risk before it outsmarts you.
Read More
Case Study
Discover how a US federal agency used MetricStream to streamline credit union audits, enhance risk visibility, and improve regulatory exam efficiency across 6,500+ institutions.
Read More
Whitepaper
Learn how GRC leaders are adopting AI responsibly and proving measurable ROI at scale.
Read MoreMetricStream Analytics can report across risk, compliance, audit, cyber, policy, control, issue, third-party, resilience, assessment, evidence, and organizational data stored or connected through the platform.
AI identifies patterns and anomalies, summarizes trends, connects contributing signals, recommends areas for attention, and creates contextual narratives for different audiences.
Yes. Report wizards and configurable dashboards let authorized users build reports and visualizations without coding.
The Context Engine Graph connects GRC records and relationships, such as risks, controls, policies, issues, actions, assets, and metrics. It helps users understand why a trend matters and what may be affected.
The Reporting Wizard lets you build custom reports step by step without coding, guiding you through data sources, filters, and layout. Advanced users can further extend it with custom data sources, scriptlets, and sub-reports to meet more complex reporting needs.
Yes. MetricStream BI Views provide ready-to-use, secure database views that connect GRC data to Power BI, Tableau, and other analytics tools, and Embedded BI provides dashboards natively within MetricStream.