





Introduction
While no organization can entirely eliminate business risk, proactive risk identification and prioritization remain foundational to resilient operations. Uncertainty is the defining theme of the global risks outlook in 2026. The Global Risks Perception Survey respondents viewed both the short- and long-term global outlook negatively. Of the respondents, 50% anticipate either a turbulent or stormy outlook over the next two years, deteriorating to 57% over the next 10 years. A risk matrix is one of the most widely used tools for managing exactly that: translating complex, multi-dimensional risk data into a visual format that supports fast, defensible decision-making. A risk matrix is a visual tool that aids in risk assessment, by mapping identified risks on a two-dimensional grid according to their likelihood of occurrence and potential impact on the organization. It is most commonly used by risk managers, compliance officers, and executive teams across industries like finance, healthcare, manufacturing, and energy. The matrix assigns each risk a composite score and a priority tier, typically color-coded from low to critical, to guide resource allocation and risk treatment decisions.
Key Takeaways
A risk matrix is a visual tool used in risk assessments to evaluate and prioritize potential risks by mapping the likelihood of an event occurring against the severity of its consequences. It helps organizations quickly identify which risks need immediate attention and which can be monitored over time. The following points summarize what a risk matrix is, how it works, and why it matters for risk-led organizations:
- A risk matrix helps organizations visualize and assess risks based on their likelihood and impact, aiding in informed decision-making.
- The risk matrix uses axes for impact and likelihood, scoring risks to categorize them, often with color coding to indicate urgency.
- For creating a risk matrix, risk managers need to identify risks, define likelihood and impact criteria, develop the grid, assess and plot risks, review and validate, and then monitor and update regularly.
- A risk matrix facilitates risk identification, resource allocation, communication, and strategic planning, and enhances accountability and transparency.
What is a Risk Matrix?
A risk matrix is a tool that helps organizations visualize and assess risks to make informed decisions. It categorizes risks based on their probability of occurrence and the potential impact on the organization. Typically, it is a grid with the likelihood of occurrence plotted on one axis and the impact of the risk on the other.
The purpose of a risk matrix is straightforward: to provide a clear, visual representation of risks that facilitates quicker and more accurate decision-making. By mapping risks onto a matrix, organizations can readily see which risks require immediate attention and which can be monitored over time.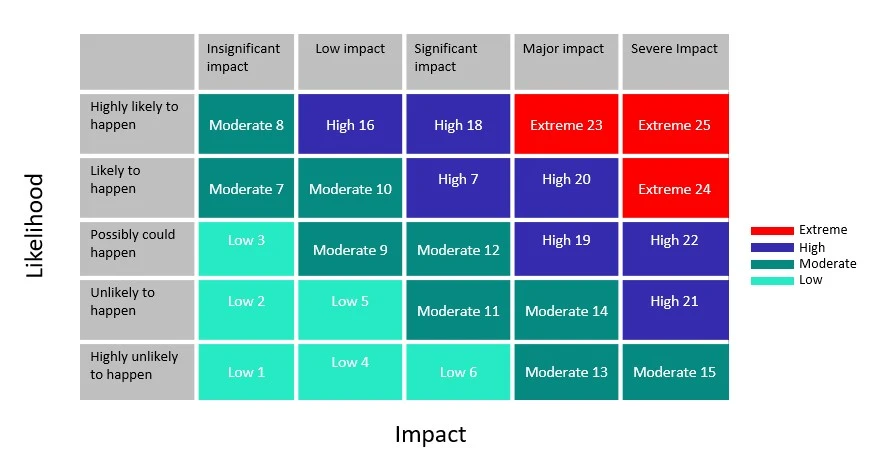
Risk Matrix Example
Let's illustrate the concept of a risk matrix with an example. Consider a medium-sized manufacturing company evaluating the risks associated with its supply chain operations. Here’s how the organization might construct and use a risk matrix:
Identify Risks:
The company first identifies a range of potential risks. For example, supplier delays, quality issues with raw materials, regulatory changes, and cybersecurity threats.
Assess Probability and Impact:
Each risk is then assessed based on two key criteria; probability and impact.
Assign Scores:
Risks are then scored on a scale, say from 1 to 5, where 1 represents the lowest probability or impact and 5 represents the highest. For instance:
- Supplier delays might be rated with a probability of 4 and an impact of 3.
- Quality issues with raw materials might have a probability of 3 and an impact of 4.
- Cybersecurity threats might score high on both fronts, with a probability of 5 and an impact of 5.
Map Risks on the Matrix:
These scores are then plotted on the risk matrix. Risks with a high probability and high impact (like cybersecurity threats) fall into the top-right quadrant, indicating they need immediate and robust mitigation strategies. On the other hand, risks with a low probability and low impact might fall into the bottom-left quadrant, indicating they require minimal attention.
Develop Mitigation Strategies:
Based on the risk matrix, the company can now prioritize its risk management efforts. High-priority risks might involve extensive mitigation plans, such as enhancing cybersecurity measures, whereas lower-priority risks might be monitored regularly but require less immediate action.
Simplified 3×3 Risk Matrix
| Likelihood ↓ / Impact → | Low | Medium | High |
| High | 🟡 Medium | 🔴 High | 🔴 Critical |
| Medium | 🟢 Low | 🟡 Medium | 🔴 High |
| Low | 🟢 Minimal | 🟢 Low | 🟡 Medium |
Standard 5×5 Risk Matrix
| Likelihood ↓ / Impact → | Negligible (1) | Minor (2) | Moderate (3) | Major (4) | Catastrophic (5) |
| Almost Certain (5) | 5 🟡 | 10 🟡 | 15 🔴 | 20 🔴 | 25 🔴 |
| Likely (4) | 4 🟢 | 8 🟡 | 12 🟡 | 16 🔴 | 20 🔴 |
| Possible (3) | 3 🟢 | 6 🟢 | 9 🟡 | 12 🟡 | 15 🔴 |
| Unlikely (2) | 2 🟢 | 4 🟢 | 6 🟢 | 8 🟡 | 10 🟡 |
| Rare (1) | 1 🟢 | 2 🟢 | 3 🟢 | 4 🟢 | 5 🟡 |
🟢 Low (1–6): Monitor | 🟡 Medium (7–12): Manage | 🔴 High (13–25): Priority action
How Does a Risk Matrix Work?
Here’s a breakdown of the mechanics of a risk matrix:
Axes of the Matrix
The risk matrix is typically structured as a grid. One axis represents the potential impact of a risk, while the other indicates the likelihood or probability of that risk occurring. Each axis is usually divided into several levels. For example, impact levels might range from insignificant to severe, while probability levels range from highly unlikely to highly likely.
Risk Scoring
Each identified risk is scored based on its impact and probability. The combination of these scores positions the risk within the matrix, categorizing it as low, moderate, high, or extreme. These categories help in prioritizing the risks.
Color Coding
To make the assessment clearer, risk matrices often use color codes. Risks positioned in the lower left (low impact, low probability) are typically green, indicating low priority. Risks in the upper right (high impact, high probability) are often red, signaling urgent attention. Intermediate risks may be yellow or orange.
When Should You Use a Risk Matrix?
A risk matrix is not a one-size-fits-all solution, but it becomes invaluable in scenarios where structured, visual risk assessment is required. Knowing when to use a risk matrix can help organizations allocate resources effectively and make informed strategic decisions.
A risk matrix adds the most value in structured, decision-critical situations. The following scenarios represent the most common and productive use cases:
1. During Project Planning
Before launching any new project, whether it's developing software, constructing infrastructure, or rolling out a marketing campaign, a risk matrix helps identify potential hurdles. It ensures project managers can prepare mitigation strategies in advance, reducing costly delays and oversights.
2. For Regulatory and Compliance Reviews
Industries with strict regulatory environments — such as finance, healthcare, or pharmaceuticals — benefit from using a risk matrix during compliance checks. It highlights high-severity, high-likelihood compliance risks, allowing for quicker remediation before audits or inspections.
3. When Evaluating Operational Changes
Introducing new technology, changing suppliers, or restructuring teams can all introduce risk. A risk matrix allows teams to assess and compare various risks objectively, making it easier to decide whether and how to move forward with the change.
4. In Periodic Risk Assessments
Many organizations conduct regular risk reviews. A risk matrix provides consistency in evaluating threats over time and helps track how the likelihood and impact of certain risks evolve. This is especially helpful in dynamic environments like cybersecurity or supply chain management.
5. For Strategic Decision-Making
Executives and boards can use a risk matrix to weigh risks tied to key business decisions, such as mergers, investments, or entering new markets. It supports data-driven deliberation by making complex risk scenarios more digestible and comparable.
6. In Crisis or Incident Response Planning
Preparing for emergencies — natural disasters, cyberattacks, PR crises — requires understanding which scenarios could cause the most damage. A risk matrix ensures that business continuity and crisis response plans are based on prioritized, evidence-based risks.
Risk Matrix Format Comparison
| Matrix Size | Best For | Advantages | Limitations |
| 3×3 | Small organizations conducting initial risk assessments, or leadership teams that need a high-level portfolio view for board reporting without granular scoring | Intuitive to build and interpret; requires minimal training; produces a clean visual that non-specialists can act on quickly | Broad bands mean meaningfully different risks can land in the same cell; limited ability to distinguish between moderate risks that warrant different treatment |
| 4×4 | Mid-size organizations that have outgrown a 3×3 but want to avoid the full complexity of a 5×5; useful where risk categories are moderately varied | Adds a layer of differentiation without significantly increasing scoring complexity; reduces the clustering problem common in 3×3 matrices | An even number of levels creates boundary ambiguity; assessors frequently disagree on whether a risk sits at level 2 or 3, reducing consistency across the portfolio |
| 5×5 | Enterprise risk management programs managing diverse, cross-functional risk portfolios where differentiation between risk levels directly influences resource allocation decisions | The most widely adopted format across regulated industries; produces 25 distinct cells that allow meaningful separation between risk tiers; integrates cleanly with most GRC platforms and ERM frameworks | Scoring consistency depends heavily on calibrated, well-defined criteria for each level; without those, assessor subjectivity increases; frontline teams without risk training can find the scoring process difficult to apply reliably |
| 7×7 | Highly regulated or safety-critical industries — nuclear, aviation, defense, advanced manufacturing — where the consequence of misjudging risk severity can be catastrophic and fine-grained differentiation is operationally necessary | Enables very precise risk stratification across 49 cells; supports nuanced prioritization in environments where a single misclassified risk can have life-safety or regulatory consequences | Requires significant calibration effort and specialist risk expertise to apply consistently; rarely appropriate outside industries where the operational stakes justify the overhead; prone to over-engineering in standard enterprise contexts |
How to Create a Risk Assessment Matrix
Building a risk matrix requires a sequenced approach to ensure consistency and reliability across the portfolio. The steps below outline a standard construction process:
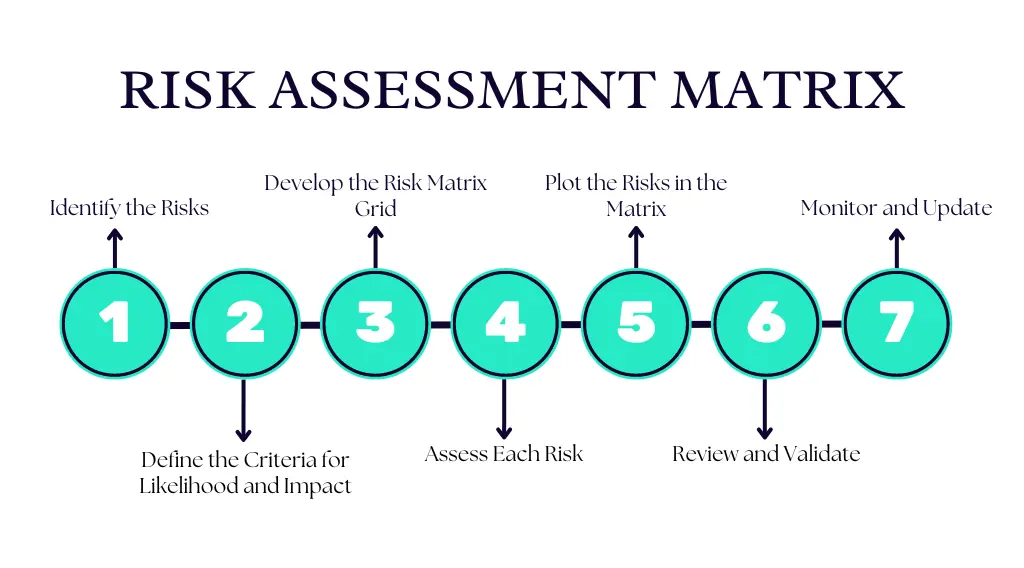
Identify the Risks
Begin by conducting a thorough risk identification exercise. This can be achieved through brainstorming sessions, expert interviews, and reviewing historical data. List down all potential risks that could impact your organization’s objectives.
Define the Criteria for Likelihood and Impact
Next, establish the criteria for assessing the likelihood and impact of each risk. This involves defining the scales and descriptors for both dimensions. For likelihood, you might use categories such as Highly Unlikely,' 'Unlikely,' 'Possible,' 'Likely,' and 'Highly Likely.' For impact, you might use 'Insignificant,' Low,' Significant,' High,' and Severe.'
Develop the Risk Matrix Grid
Create a grid where one axis represents the likelihood and the other represents the impact. Label the axes according to the scales you have defined. Each cell in the grid will represent a specific combination of likelihood and impact.
Assess Each Risk
Evaluate each identified risk based on the defined criteria. Assign scores for both the impact and probability. For instance, a risk might have a moderate impact (3) but be unlikely to occur (2).
Plot the Risks in the Matrix
Create a grid with impact levels on one axis and probability levels on the other. Plot each risk according to its scores and subsequently color code it. The intersection point on the grid indicates the overall risk level.
Review and Validate
Once the initial matrix is complete, review it for accuracy and comprehensiveness. Validate the assessments with stakeholders and experts to ensure that the risk levels are realistic and the matrix accurately reflects the organization’s risk environment.
Monitor and Update
A risk matrix is not a one-time effort—it requires ongoing monitoring and updating. The matrix should be reviewed and adjusted regularly to reflect new risks, changes in existing risks, and shifts in the organizational or external environment.
Benefits of a Risk Matrix
The value of a risk matrix extends beyond simple visualization. Because it translates qualitative risk judgments into a structured, comparable format, it supports decision-making across functions, from the front line to the board, and across time, from project planning to periodic review. The benefits span operational, communicative, and strategic dimensions.
Key benefits organizations realize from a well-maintained risk matrix include:
Identification of Critical Risks:
By plotting identified risks on the matrix, organizations can clearly see which risks need immediate attention and which are less urgent. This visualization aids in not overlooking minor risks while ensuring critical risks are prioritized.
Resource Allocation:
With a clear visual representation, decision-makers can allocate resources more effectively, focusing on high-priority risks that could significantly impact the organization.
Communication:
The risk matrix serves as a communication tool that translates complex risk assessments into a simple, comprehensible format for all stakeholders, from executives to team members.
Strategic Planning:
By identifying and prioritizing risks, the risk matrix supports strategic planning and helps in forming actionable risk management strategies. It allows for preemptive action rather than reactive measures.
Accountability and Transparency:
The visual nature of the risk matrix fosters accountability by clearly delineating who is responsible for managing each risk. It also enhances transparency, making it easier to track progress and report on risk management efforts.
How GRC Platforms Support Risk Matrix Management
Managing a risk matrix manually, whether in spreadsheets or static documents, introduces consistency gaps, version control problems, and reporting delays that undermine the tool's core purpose. GRC platforms address these limitations by connecting the risk matrix to the underlying data, workflows, and reporting infrastructure that keep it current and decision-ready. The capabilities that matter most span three areas:
Centralized risk data and portfolio visibility; a GRC platform consolidates all risk assessments, likelihood and impact scores, control mappings, and review histories into a single governed repository. This means every position on the risk matrix reflects the same underlying data set, eliminating the divergence that occurs when business units maintain separate spreadsheets with inconsistent scoring criteria. Risk owners, assessors, and executive stakeholders all work from one version of the portfolio, which makes the matrix a reliable decision-making surface rather than a snapshot that is outdated the moment it is distributed.
Automated scoring, control linkage, and threshold alerts; rather than requiring manual recalculation each time a risk is reassessed, GRC platforms update risk scores automatically as assessment inputs change. Controls are mapped directly to the risks they mitigate, so the platform can calculate and display both inherent and residual risk positions on the matrix in real time. Configurable threshold alerts notify risk owners when a risk score crosses a defined boundary, ensuring that material changes in the portfolio surface immediately rather than waiting for the next scheduled review cycle.
Executive and board-level reporting; the risk matrix is most valuable when it reaches the people responsible for resource allocation and strategic decisions, and GRC platforms are built to support that escalation path. Automated reporting tools generate risk dashboards and committee-ready outputs directly from the live matrix data, reducing the manual effort required to translate risk assessments into leadership communications. Drill-down functionality allows executives to move from the high-level portfolio view to individual risk records without requesting separate reports from the risk team.
How MetricStream Can Help
Translating a risk matrix from a static grid into a dynamic, organization-wide risk management capability requires a platform that connects assessment data, control performance, and reporting in a single governed environment. MetricStream's Enterprise Risk Management solution provides exactly that foundation, offering configurable risk matrix visualization that updates in real time as risk assessments are revised, controls are tested, and new risks are identified. Organizations can define their own matrix dimensions, whether a 3×3 for executive reporting or a 5×5 for operational risk programs, and align color-coded risk zones directly to their board-approved risk appetite thresholds.
Beyond visualization, MetricStream connects the risk matrix to the broader risk lifecycle. Risk owners receive automated notifications when scores approach or cross threshold levels, ensuring that escalation is systematic rather than dependent on manual monitoring. The platform's control mapping capabilities allow organizations to track the gap between inherent and residual risk positions across the portfolio, providing a continuous, auditable view of how effectively controls are performing against the risks they are designed to mitigate.
For organizations operating across multiple business units, geographies, or regulatory frameworks, MetricStream's connected architecture ensures that risk matrix data rolls up consistently from the operational level to enterprise-wide reporting, giving risk leaders and boards the portfolio clarity they need to make informed, timely decisions.
While no organization can entirely eliminate business risk, proactive risk identification and prioritization remain foundational to resilient operations. Uncertainty is the defining theme of the global risks outlook in 2026. The Global Risks Perception Survey respondents viewed both the short- and long-term global outlook negatively. Of the respondents, 50% anticipate either a turbulent or stormy outlook over the next two years, deteriorating to 57% over the next 10 years. A risk matrix is one of the most widely used tools for managing exactly that: translating complex, multi-dimensional risk data into a visual format that supports fast, defensible decision-making. A risk matrix is a visual tool that aids in risk assessment, by mapping identified risks on a two-dimensional grid according to their likelihood of occurrence and potential impact on the organization. It is most commonly used by risk managers, compliance officers, and executive teams across industries like finance, healthcare, manufacturing, and energy. The matrix assigns each risk a composite score and a priority tier, typically color-coded from low to critical, to guide resource allocation and risk treatment decisions.
A risk matrix is a visual tool used in risk assessments to evaluate and prioritize potential risks by mapping the likelihood of an event occurring against the severity of its consequences. It helps organizations quickly identify which risks need immediate attention and which can be monitored over time. The following points summarize what a risk matrix is, how it works, and why it matters for risk-led organizations:
- A risk matrix helps organizations visualize and assess risks based on their likelihood and impact, aiding in informed decision-making.
- The risk matrix uses axes for impact and likelihood, scoring risks to categorize them, often with color coding to indicate urgency.
- For creating a risk matrix, risk managers need to identify risks, define likelihood and impact criteria, develop the grid, assess and plot risks, review and validate, and then monitor and update regularly.
- A risk matrix facilitates risk identification, resource allocation, communication, and strategic planning, and enhances accountability and transparency.
A risk matrix is a tool that helps organizations visualize and assess risks to make informed decisions. It categorizes risks based on their probability of occurrence and the potential impact on the organization. Typically, it is a grid with the likelihood of occurrence plotted on one axis and the impact of the risk on the other.
The purpose of a risk matrix is straightforward: to provide a clear, visual representation of risks that facilitates quicker and more accurate decision-making. By mapping risks onto a matrix, organizations can readily see which risks require immediate attention and which can be monitored over time.
Let's illustrate the concept of a risk matrix with an example. Consider a medium-sized manufacturing company evaluating the risks associated with its supply chain operations. Here’s how the organization might construct and use a risk matrix:
Identify Risks:
The company first identifies a range of potential risks. For example, supplier delays, quality issues with raw materials, regulatory changes, and cybersecurity threats.
Assess Probability and Impact:
Each risk is then assessed based on two key criteria; probability and impact.
Assign Scores:
Risks are then scored on a scale, say from 1 to 5, where 1 represents the lowest probability or impact and 5 represents the highest. For instance:
- Supplier delays might be rated with a probability of 4 and an impact of 3.
- Quality issues with raw materials might have a probability of 3 and an impact of 4.
- Cybersecurity threats might score high on both fronts, with a probability of 5 and an impact of 5.
Map Risks on the Matrix:
These scores are then plotted on the risk matrix. Risks with a high probability and high impact (like cybersecurity threats) fall into the top-right quadrant, indicating they need immediate and robust mitigation strategies. On the other hand, risks with a low probability and low impact might fall into the bottom-left quadrant, indicating they require minimal attention.
Develop Mitigation Strategies:
Based on the risk matrix, the company can now prioritize its risk management efforts. High-priority risks might involve extensive mitigation plans, such as enhancing cybersecurity measures, whereas lower-priority risks might be monitored regularly but require less immediate action.
Simplified 3×3 Risk Matrix
| Likelihood ↓ / Impact → | Low | Medium | High |
| High | 🟡 Medium | 🔴 High | 🔴 Critical |
| Medium | 🟢 Low | 🟡 Medium | 🔴 High |
| Low | 🟢 Minimal | 🟢 Low | 🟡 Medium |
Standard 5×5 Risk Matrix
| Likelihood ↓ / Impact → | Negligible (1) | Minor (2) | Moderate (3) | Major (4) | Catastrophic (5) |
| Almost Certain (5) | 5 🟡 | 10 🟡 | 15 🔴 | 20 🔴 | 25 🔴 |
| Likely (4) | 4 🟢 | 8 🟡 | 12 🟡 | 16 🔴 | 20 🔴 |
| Possible (3) | 3 🟢 | 6 🟢 | 9 🟡 | 12 🟡 | 15 🔴 |
| Unlikely (2) | 2 🟢 | 4 🟢 | 6 🟢 | 8 🟡 | 10 🟡 |
| Rare (1) | 1 🟢 | 2 🟢 | 3 🟢 | 4 🟢 | 5 🟡 |
🟢 Low (1–6): Monitor | 🟡 Medium (7–12): Manage | 🔴 High (13–25): Priority action
Here’s a breakdown of the mechanics of a risk matrix:
Axes of the Matrix
The risk matrix is typically structured as a grid. One axis represents the potential impact of a risk, while the other indicates the likelihood or probability of that risk occurring. Each axis is usually divided into several levels. For example, impact levels might range from insignificant to severe, while probability levels range from highly unlikely to highly likely.
Risk Scoring
Each identified risk is scored based on its impact and probability. The combination of these scores positions the risk within the matrix, categorizing it as low, moderate, high, or extreme. These categories help in prioritizing the risks.
Color Coding
To make the assessment clearer, risk matrices often use color codes. Risks positioned in the lower left (low impact, low probability) are typically green, indicating low priority. Risks in the upper right (high impact, high probability) are often red, signaling urgent attention. Intermediate risks may be yellow or orange.
A risk matrix is not a one-size-fits-all solution, but it becomes invaluable in scenarios where structured, visual risk assessment is required. Knowing when to use a risk matrix can help organizations allocate resources effectively and make informed strategic decisions.
A risk matrix adds the most value in structured, decision-critical situations. The following scenarios represent the most common and productive use cases:
1. During Project Planning
Before launching any new project, whether it's developing software, constructing infrastructure, or rolling out a marketing campaign, a risk matrix helps identify potential hurdles. It ensures project managers can prepare mitigation strategies in advance, reducing costly delays and oversights.
2. For Regulatory and Compliance Reviews
Industries with strict regulatory environments — such as finance, healthcare, or pharmaceuticals — benefit from using a risk matrix during compliance checks. It highlights high-severity, high-likelihood compliance risks, allowing for quicker remediation before audits or inspections.
3. When Evaluating Operational Changes
Introducing new technology, changing suppliers, or restructuring teams can all introduce risk. A risk matrix allows teams to assess and compare various risks objectively, making it easier to decide whether and how to move forward with the change.
4. In Periodic Risk Assessments
Many organizations conduct regular risk reviews. A risk matrix provides consistency in evaluating threats over time and helps track how the likelihood and impact of certain risks evolve. This is especially helpful in dynamic environments like cybersecurity or supply chain management.
5. For Strategic Decision-Making
Executives and boards can use a risk matrix to weigh risks tied to key business decisions, such as mergers, investments, or entering new markets. It supports data-driven deliberation by making complex risk scenarios more digestible and comparable.
6. In Crisis or Incident Response Planning
Preparing for emergencies — natural disasters, cyberattacks, PR crises — requires understanding which scenarios could cause the most damage. A risk matrix ensures that business continuity and crisis response plans are based on prioritized, evidence-based risks.
Risk Matrix Format Comparison
| Matrix Size | Best For | Advantages | Limitations |
| 3×3 | Small organizations conducting initial risk assessments, or leadership teams that need a high-level portfolio view for board reporting without granular scoring | Intuitive to build and interpret; requires minimal training; produces a clean visual that non-specialists can act on quickly | Broad bands mean meaningfully different risks can land in the same cell; limited ability to distinguish between moderate risks that warrant different treatment |
| 4×4 | Mid-size organizations that have outgrown a 3×3 but want to avoid the full complexity of a 5×5; useful where risk categories are moderately varied | Adds a layer of differentiation without significantly increasing scoring complexity; reduces the clustering problem common in 3×3 matrices | An even number of levels creates boundary ambiguity; assessors frequently disagree on whether a risk sits at level 2 or 3, reducing consistency across the portfolio |
| 5×5 | Enterprise risk management programs managing diverse, cross-functional risk portfolios where differentiation between risk levels directly influences resource allocation decisions | The most widely adopted format across regulated industries; produces 25 distinct cells that allow meaningful separation between risk tiers; integrates cleanly with most GRC platforms and ERM frameworks | Scoring consistency depends heavily on calibrated, well-defined criteria for each level; without those, assessor subjectivity increases; frontline teams without risk training can find the scoring process difficult to apply reliably |
| 7×7 | Highly regulated or safety-critical industries — nuclear, aviation, defense, advanced manufacturing — where the consequence of misjudging risk severity can be catastrophic and fine-grained differentiation is operationally necessary | Enables very precise risk stratification across 49 cells; supports nuanced prioritization in environments where a single misclassified risk can have life-safety or regulatory consequences | Requires significant calibration effort and specialist risk expertise to apply consistently; rarely appropriate outside industries where the operational stakes justify the overhead; prone to over-engineering in standard enterprise contexts |
Building a risk matrix requires a sequenced approach to ensure consistency and reliability across the portfolio. The steps below outline a standard construction process:
Identify the Risks
Begin by conducting a thorough risk identification exercise. This can be achieved through brainstorming sessions, expert interviews, and reviewing historical data. List down all potential risks that could impact your organization’s objectives.
Define the Criteria for Likelihood and Impact
Next, establish the criteria for assessing the likelihood and impact of each risk. This involves defining the scales and descriptors for both dimensions. For likelihood, you might use categories such as Highly Unlikely,' 'Unlikely,' 'Possible,' 'Likely,' and 'Highly Likely.' For impact, you might use 'Insignificant,' Low,' Significant,' High,' and Severe.'
Develop the Risk Matrix Grid
Create a grid where one axis represents the likelihood and the other represents the impact. Label the axes according to the scales you have defined. Each cell in the grid will represent a specific combination of likelihood and impact.
Assess Each Risk
Evaluate each identified risk based on the defined criteria. Assign scores for both the impact and probability. For instance, a risk might have a moderate impact (3) but be unlikely to occur (2).
Plot the Risks in the Matrix
Create a grid with impact levels on one axis and probability levels on the other. Plot each risk according to its scores and subsequently color code it. The intersection point on the grid indicates the overall risk level.
Review and Validate
Once the initial matrix is complete, review it for accuracy and comprehensiveness. Validate the assessments with stakeholders and experts to ensure that the risk levels are realistic and the matrix accurately reflects the organization’s risk environment.
Monitor and Update
A risk matrix is not a one-time effort—it requires ongoing monitoring and updating. The matrix should be reviewed and adjusted regularly to reflect new risks, changes in existing risks, and shifts in the organizational or external environment.
The value of a risk matrix extends beyond simple visualization. Because it translates qualitative risk judgments into a structured, comparable format, it supports decision-making across functions, from the front line to the board, and across time, from project planning to periodic review. The benefits span operational, communicative, and strategic dimensions.
Key benefits organizations realize from a well-maintained risk matrix include:
Identification of Critical Risks:
By plotting identified risks on the matrix, organizations can clearly see which risks need immediate attention and which are less urgent. This visualization aids in not overlooking minor risks while ensuring critical risks are prioritized.
Resource Allocation:
With a clear visual representation, decision-makers can allocate resources more effectively, focusing on high-priority risks that could significantly impact the organization.
Communication:
The risk matrix serves as a communication tool that translates complex risk assessments into a simple, comprehensible format for all stakeholders, from executives to team members.
Strategic Planning:
By identifying and prioritizing risks, the risk matrix supports strategic planning and helps in forming actionable risk management strategies. It allows for preemptive action rather than reactive measures.
Accountability and Transparency:
The visual nature of the risk matrix fosters accountability by clearly delineating who is responsible for managing each risk. It also enhances transparency, making it easier to track progress and report on risk management efforts.
How GRC Platforms Support Risk Matrix Management
Managing a risk matrix manually, whether in spreadsheets or static documents, introduces consistency gaps, version control problems, and reporting delays that undermine the tool's core purpose. GRC platforms address these limitations by connecting the risk matrix to the underlying data, workflows, and reporting infrastructure that keep it current and decision-ready. The capabilities that matter most span three areas:
Centralized risk data and portfolio visibility; a GRC platform consolidates all risk assessments, likelihood and impact scores, control mappings, and review histories into a single governed repository. This means every position on the risk matrix reflects the same underlying data set, eliminating the divergence that occurs when business units maintain separate spreadsheets with inconsistent scoring criteria. Risk owners, assessors, and executive stakeholders all work from one version of the portfolio, which makes the matrix a reliable decision-making surface rather than a snapshot that is outdated the moment it is distributed.
Automated scoring, control linkage, and threshold alerts; rather than requiring manual recalculation each time a risk is reassessed, GRC platforms update risk scores automatically as assessment inputs change. Controls are mapped directly to the risks they mitigate, so the platform can calculate and display both inherent and residual risk positions on the matrix in real time. Configurable threshold alerts notify risk owners when a risk score crosses a defined boundary, ensuring that material changes in the portfolio surface immediately rather than waiting for the next scheduled review cycle.
Executive and board-level reporting; the risk matrix is most valuable when it reaches the people responsible for resource allocation and strategic decisions, and GRC platforms are built to support that escalation path. Automated reporting tools generate risk dashboards and committee-ready outputs directly from the live matrix data, reducing the manual effort required to translate risk assessments into leadership communications. Drill-down functionality allows executives to move from the high-level portfolio view to individual risk records without requesting separate reports from the risk team.
Translating a risk matrix from a static grid into a dynamic, organization-wide risk management capability requires a platform that connects assessment data, control performance, and reporting in a single governed environment. MetricStream's Enterprise Risk Management solution provides exactly that foundation, offering configurable risk matrix visualization that updates in real time as risk assessments are revised, controls are tested, and new risks are identified. Organizations can define their own matrix dimensions, whether a 3×3 for executive reporting or a 5×5 for operational risk programs, and align color-coded risk zones directly to their board-approved risk appetite thresholds.
Beyond visualization, MetricStream connects the risk matrix to the broader risk lifecycle. Risk owners receive automated notifications when scores approach or cross threshold levels, ensuring that escalation is systematic rather than dependent on manual monitoring. The platform's control mapping capabilities allow organizations to track the gap between inherent and residual risk positions across the portfolio, providing a continuous, auditable view of how effectively controls are performing against the risks they are designed to mitigate.
For organizations operating across multiple business units, geographies, or regulatory frameworks, MetricStream's connected architecture ensures that risk matrix data rolls up consistently from the operational level to enterprise-wide reporting, giving risk leaders and boards the portfolio clarity they need to make informed, timely decisions.
Frequently Asked Questions
A risk matrix is a visual tool that maps identified risks on a two-dimensional grid according to likelihood and potential impact, helping organizations prioritize which risks require immediate action and which can be monitored over time.
A risk matrix's size determines its scoring granularity, with 3×3 suited to simpler environments, 5×5 the most common enterprise standard, and 7×7 reserved for high-stakes industries such as aviation and nuclear where maximum precision is required.
Creating a risk matrix involves defining likelihood and impact scales with clear criteria for each level, building the grid, scoring each identified risk against both dimensions, and assigning color-coded risk zones aligned to the organization's risk appetite.
Inherent risk reflects exposure before any controls are applied, while residual risk is what remains after controls are in place, and many organizations plot both positions on the matrix to show the value their controls are delivering.
Risk matrices are subject to well-documented limitations including assessor subjectivity, oversimplification of interconnected risks, static point-in-time snapshots, false numerical precision from multiplied scores, and an inability to capture risk velocity, which means they should be used alongside other risk management tools.
A risk score is a numerical value derived from multiplying a risk's likelihood rating by its impact rating, producing a composite figure that determines where the risk falls on the matrix and how urgently it requires a response.
A risk matrix should be reviewed at minimum annually, with event-triggered updates whenever a significant new risk emerges, a control failure is detected, or a major business or regulatory change alters the risk landscape.
A risk matrix is a visualization tool that shows relative risk prioritization across the portfolio, while a risk register is the underlying database recording each risk's detail, ownership, treatment strategy, and review history that populates the matrix.
A risk matrix is widely used in cyber risk assessment, with likelihood assessed based on threat intelligence and vulnerability exposure, and impact evaluated across data loss, system downtime, regulatory penalties, and reputational damage, consistent with frameworks such as NIST CSF.
MetricStream's Enterprise Risk Management platform provides configurable risk matrix visualization connected to live risk register data, supporting customizable matrix sizes, separate views for inherent and residual risk, drill-down from matrix cells to individual risk records, and automated alerts when risks cross threshold scores.